Bitcoin Price Analysis Following The $2,000 Plunge: Can The Ascending Support Line Stop The Blood?
Just yesterday, following the impressive BTC price rally to over $13,000, I mentioned here to stay ‘feet on the ground.’ Taken from yesterday’s analysis:
“However, such volatility can trigger deep corrections, and 10% surge can quickly end up in a correction of that size to the bearish direction.”
Unfortunate to the bulls, this is precisely what happened. Bitcoin saw a $2,000 daily turnover marking $11,000 as its current daily low (and the price area as of writing this update).
Things are changing very quickly: The volatility level is extreme. An important trading tip on such crazy days is not to trade too much, especially under foggy conditions like we see in those days. The mood can change quickly at any time, any minute. However, some key levels are critical for the short-term. Let’s see them below.
Total Market Cap: $307 billion
Bitcoin Market Cap: $200 billion (Bitcoin is back to the $200 Billion area, losing 15% on the daily)
BTC Dominance Index: 65.1%
*Data by CoinGecko
Key Levels to Watch
– Support/Resistance:
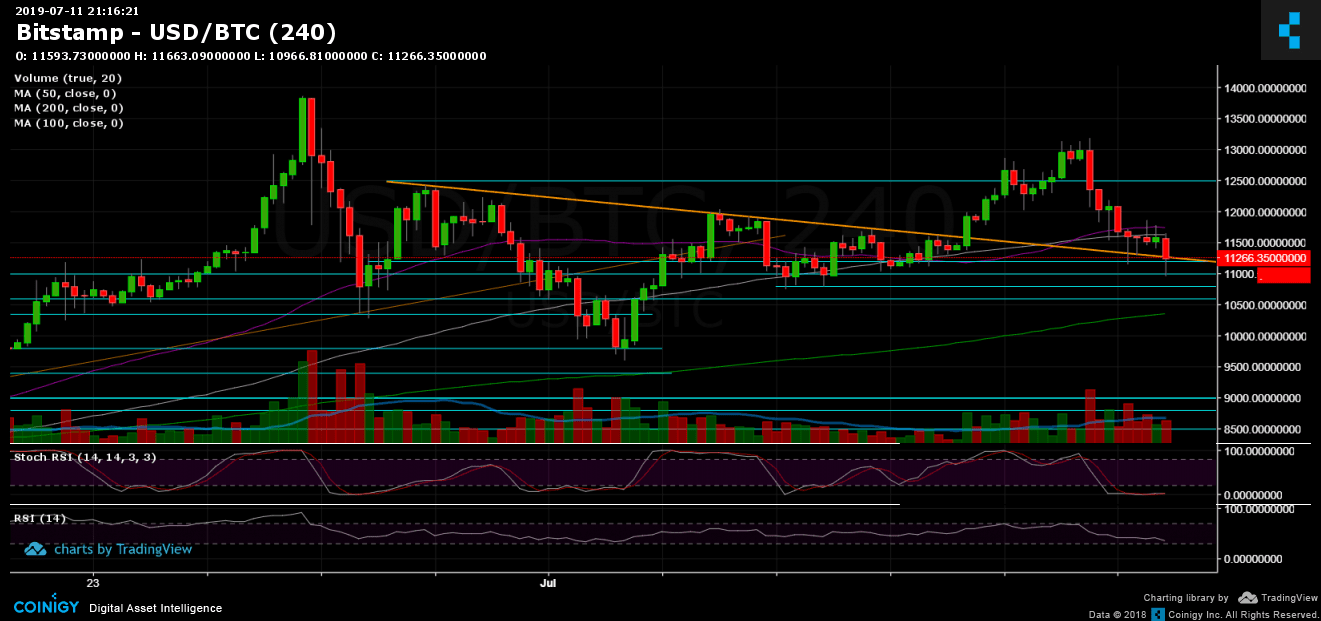
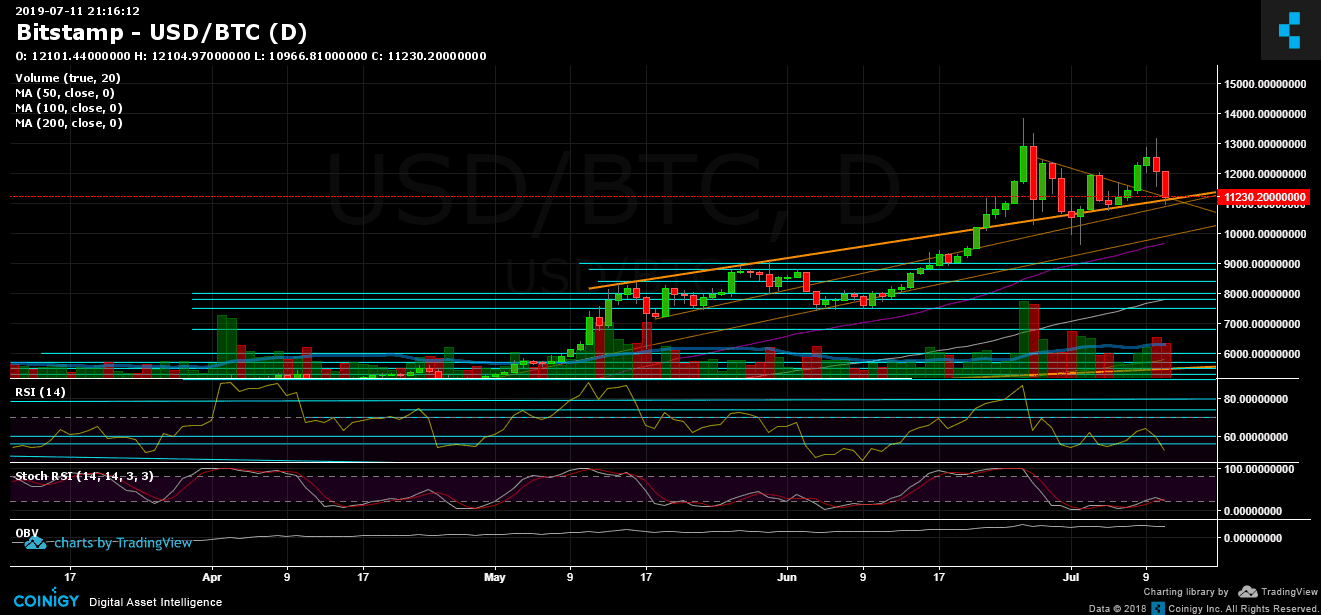
Following the red horror candle we see on the daily chart, Bitcoin is now struggling with the $11,000 support area, along with the mid-term ascending trend-line that started forming in the middle of May (marked with orange on the daily chart). A breakdown here and the next support levels lie at $10,800, $10,600, $10,300 (along with the MA-200 of the 4-hour chart) and $10,000. Below $10K, two critical levels to watch for: $9,600, which is the low from ten days ago, and $9,400 – a significant support level of the previous double top from June.
$9,600 is the key level here, in my opinion. Breaking below and a new lower low will be created that might change the trend for the longer term.
From above, there are the support turned resistance levels at $11,200, $11,500 – $11,600 area, $12,000 and $12,500. Above the last is the high that was reached yesterday at $13,000 – $13,200.
– Daily chart’s RSI: Things get choppy very quickly also here – The RSI indicator is facing the 50 area. This is the lowest level of the past 30 days since Bitcoin was trading for under $8,000. The RSI could turn bearish very quickly, unless the momentum comes back soon to lift the RSI above the 55 support level turned resistance RSI level.
– Trading Volume: A huge amount of volume level followed the last two bloody days. This comes after the nice green volume of the past week. Momentum can change very quickly, as mentioned above.
– BitFinex open short positions: Another odd drop in the shorts took place since yesterday. 63% of the open positions were closed. This could be related to today’s unscheduled BitFinex offline period. However, this could also turn into a long squeeze.
BTC/USD BitStamp 4-Hour Chart
BTC/USD BitStamp 1-Day Chart
The post Bitcoin Price Analysis Following The $2,000 Plunge: Can The Ascending Support Line Stop The Blood? appeared first on CryptoPotato.