Bitcoin Price Analysis Feb.8: Bitcoin Finally Broke Up, What’s Next?
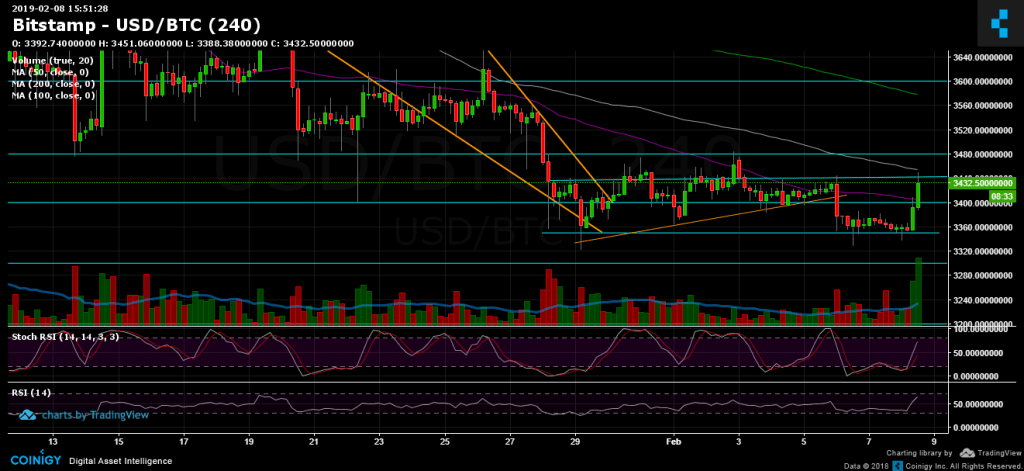
After two more days of consolidation, Bitcoin finally made a slight move: the last two 4-hour candles were neat and green and brought the coin back above the $3400 resistance level.
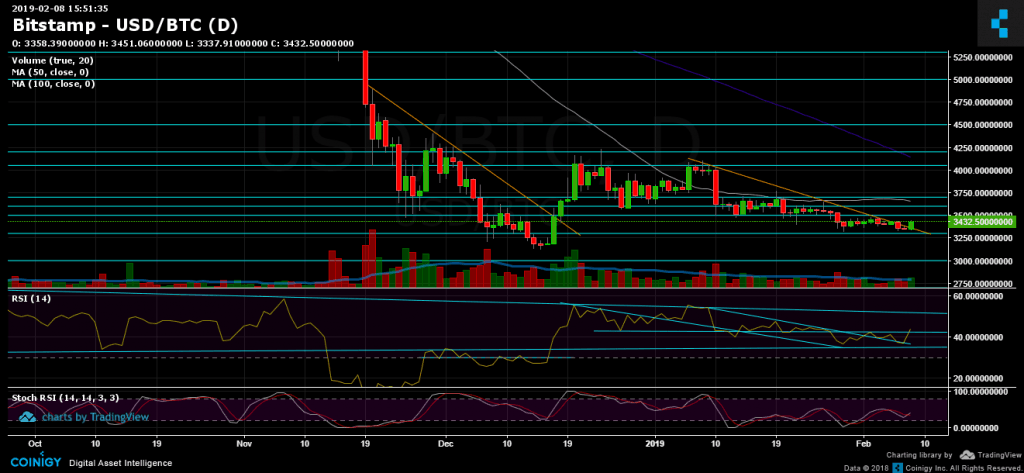
Looking at the daily chart as of now, the descending trend-line got broken up. However, there is still time until the daily candle closes.
In case the daily candle confirms a breakout, followed by a decent amount of green volume, it could be a very positive sign for Bitcoin’s short-term.
Looking at the 1-day & 4-hour charts
- The daily chart’s RSI: RSI is currently facing a resistance trend-line, as of writing this update. To continue bullish, Bitcoin’s RSI has to overcome the 43-44 level.
- Support and resistance areas: after breaking up $3400, along with the 4-hour 50 days moving average line, the level has turned into being support for the short-term. The next support lies around $3350 – $3360, before reaching down to test the $3300. Below are the $3200 support and 2018 lowest price of $3120.
- From above: $3440 – $3450 is the next resistance level (the 4-hour 100 days moving average line, marked in white). The next major resistance area is the $3480 – $3500 zone, including the 100 days moving average line (marked in white). Further lies $3600 and $3650 (along with the daily chart’s 50 days moving average line, marked in white).
To start thinking bullish for the mid-term, Bitcoin has to return above the critical 50 days moving average line of the daily chart, which is hovering around $3650. - The trading volume has risen, and has the potential to turn into a reversal day for the short-term. Let’s see what the next hours will lead.
- BitFinex’s open short positions increased to 27K BTC of open positions.
BTC/USD BitStamp 4-Hour chart
BTC/USD BitStamp 1-Day chart
The post Bitcoin Price Analysis Feb.8: Bitcoin Finally Broke Up, What’s Next? appeared first on CryptoPotato.