Bitcoin Price Analysis Feb.6: Low Volume Show No Interest As BTC Re-Testing $3350 Weekly Low
Following three trading days whereas Bitcoin was ranging between $3400 to $3450, the ascending trend-line had broken down, and Bitcoin recorded a current daily low of $3350.
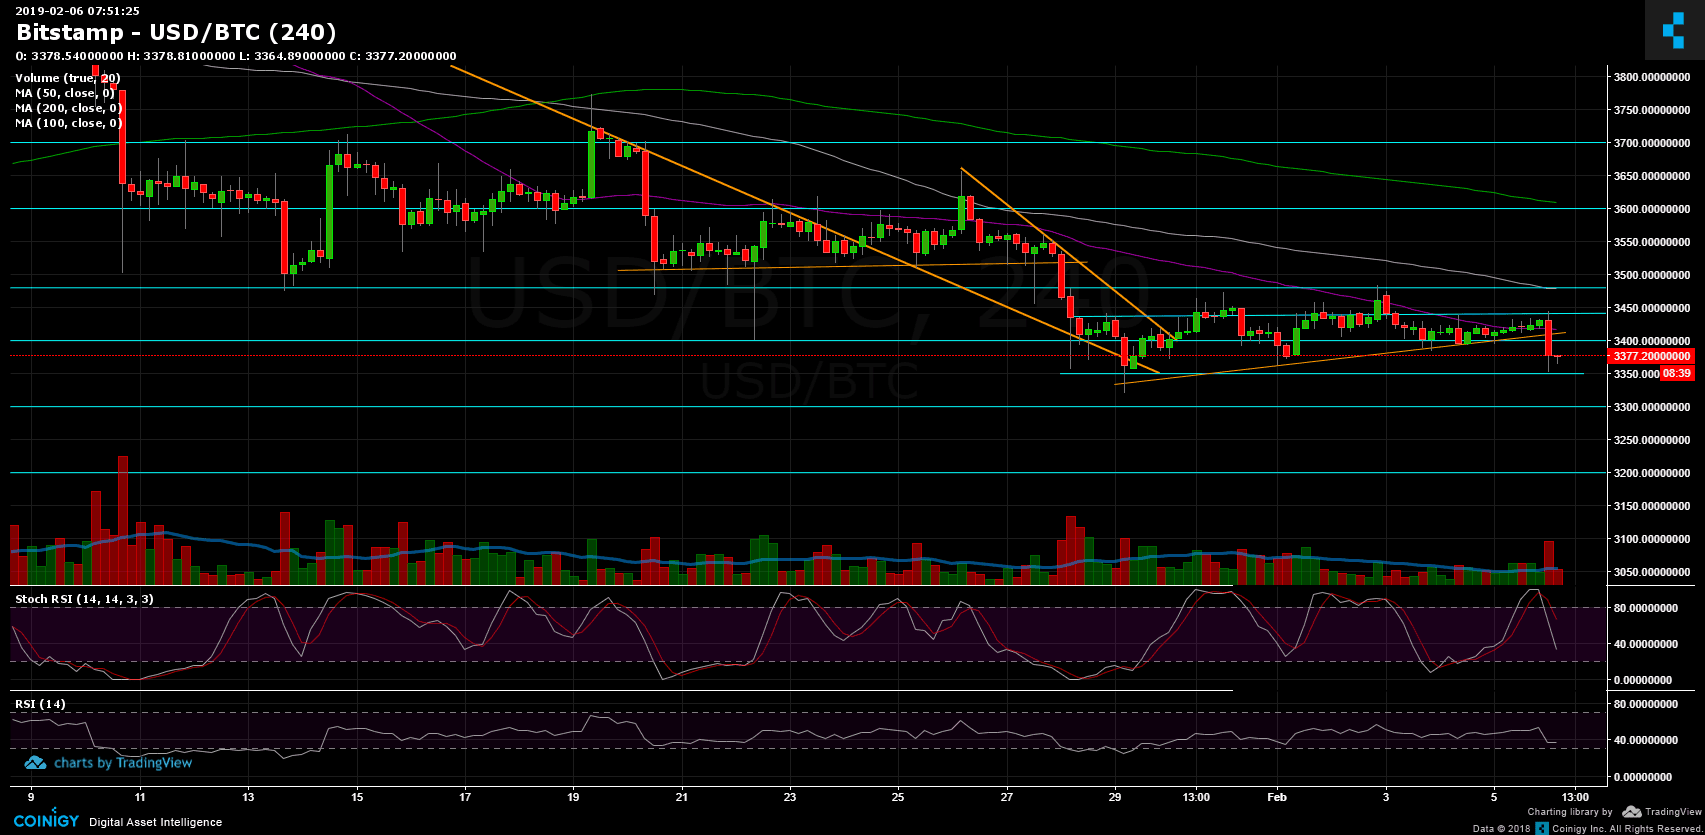
This move is, indeed, not yet the significant move we’ve anticipated, but it got Bitcoin to retest the support line around $3350 – $3360 for the fourth time during the past week.
Remember, the more times a trend-line is being tested, the higher the chances to receive a break of that line.
Looking at the 1-day & 4-hour charts
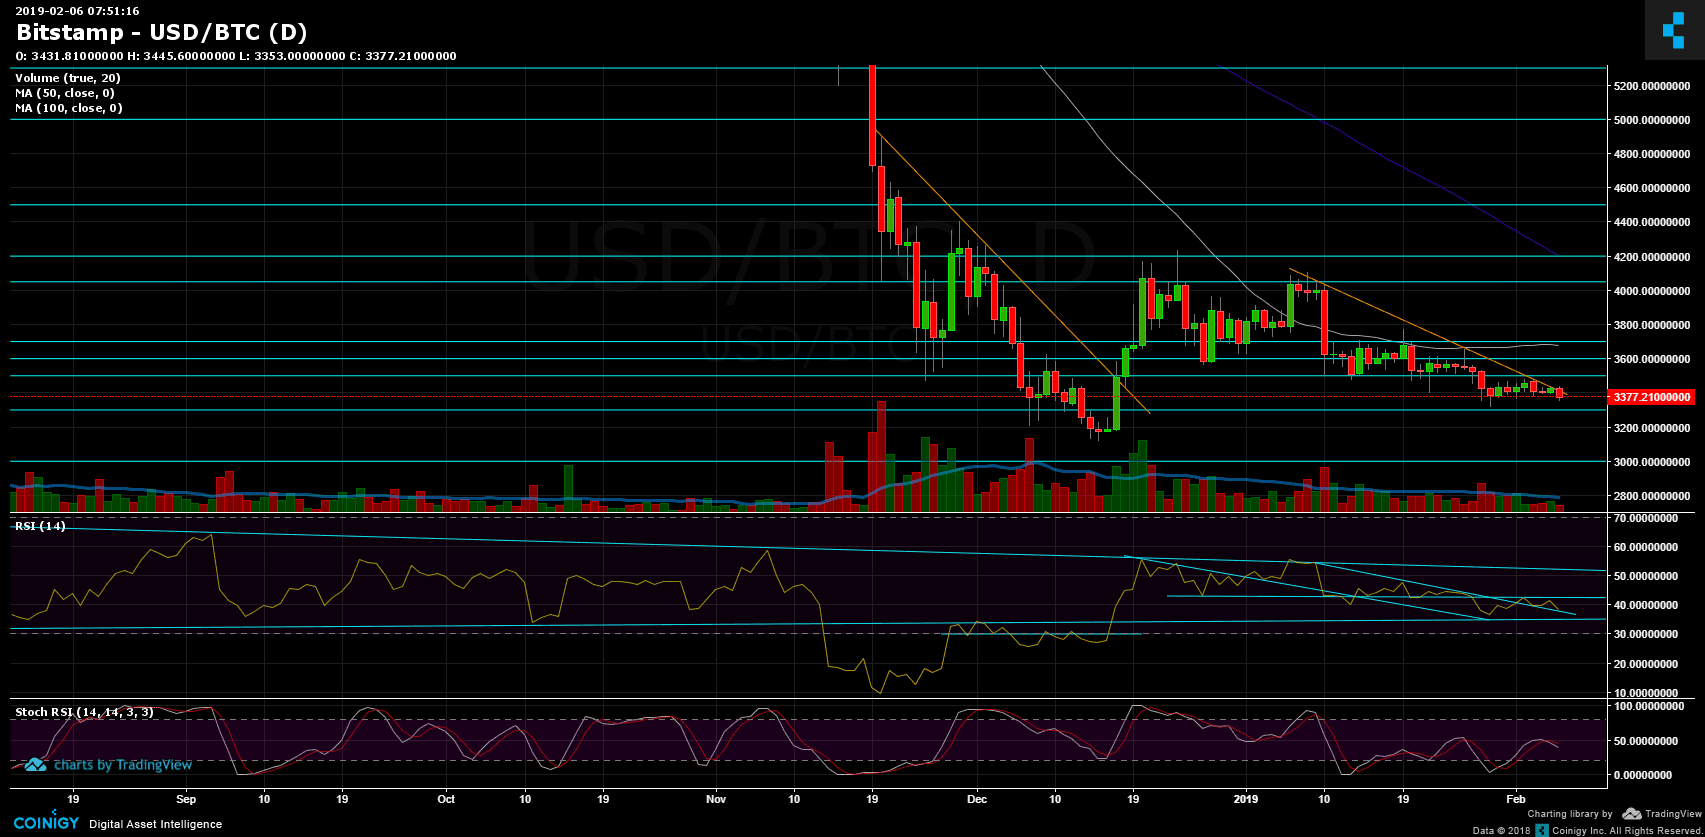
- Looking at the bigger picture (the daily chart): Bitcoin is following down the descending trend-line, which had formed a month ago (January 8, when BTC was $4100). Each of the recent days had touched the line, while today’s candle is critical for Bitcoin’s short future.
In case of a break-up, followed by high trading volume, we could see a reversal. Unfortunately, all signals aren’t pointing to that scenario. - The daily chart’s RSI is moving between resistance line of 43 and descending support line. The support-line is nearby; it will be interesting to see if it will hold up this time.
- Support and resistance levels: as mentioned before, the next support lies around $3350 – $3360, before reaching down to test the $3300. Below are the $3200 support and 2018 lowest price of $3120. From above, $3400 now serves as resistance, while nearby lies the 4-hour 50 days moving average line, marked in purple. The next major resistance area is the $3480 – $3500 zone, including the 100 days moving average line (marked in white).
- The trading volume is very low. We can definitely identify low interest in the Bitcoin market nowdays. Some of the volume had diverted into hot altcoins such as BitTorrent and BNB.
- BitFinex’s open short positions decreased to 23.7K BTC of open positions.
BTC/USD BitStamp 4-Hour chart
BTC/USD BitStamp 1-Day chart
The post Bitcoin Price Analysis Feb.6: Low Volume Show No Interest As BTC Re-Testing $3350 Weekly Low appeared first on CryptoPotato.