Bitcoin Price Analysis Feb.20: Following Massive Gains, Could BTC Break-up $4000?
In our previous price analysis, we’ve mentioned the option that Bitcoin can turn bullish for the short-term in the case of breaking up the significant 50-days moving average line on the daily chart (around the $3600 – $3620 area).
Not only that Bitcoin broke up the above, but quickly surpassed the $3700 and the $3800 – $3850 resistance levels, til encountering the $3950 resistance mark. The daily high had reached $4000 for a short moment (on Bitstamp). It was a fantastic day for the bulls, so what’s next?
Looking at the 1-day & 4-hour charts
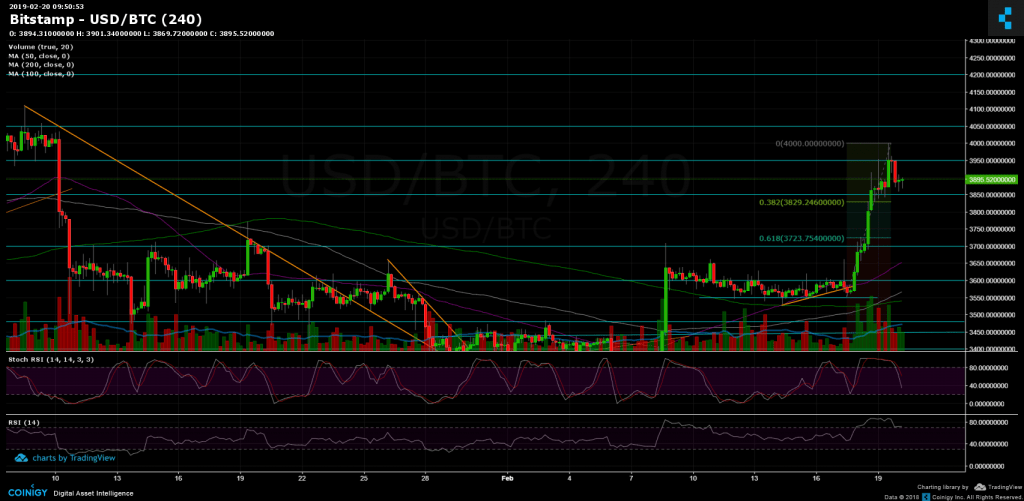
– As mentioned, Bitcoin had completed a fabulous 2-day move. For the past hours, we notice a consolidation between the range of $3850 and $3950.
– Support and resistance levels: From above, breaking up the $3950 area, would likely to send Bitcoin to retest the $4050 resistance, before getting to the significant $4200.
– From below: Resistance turned support areas at $3800 – $3850 (along with 38.2% Fib retracement level at $3830), $3700 area (along with 61.8% Fib retracement level at $3723), and $3600 famous area (along with MA-50 of the 1-day chart).
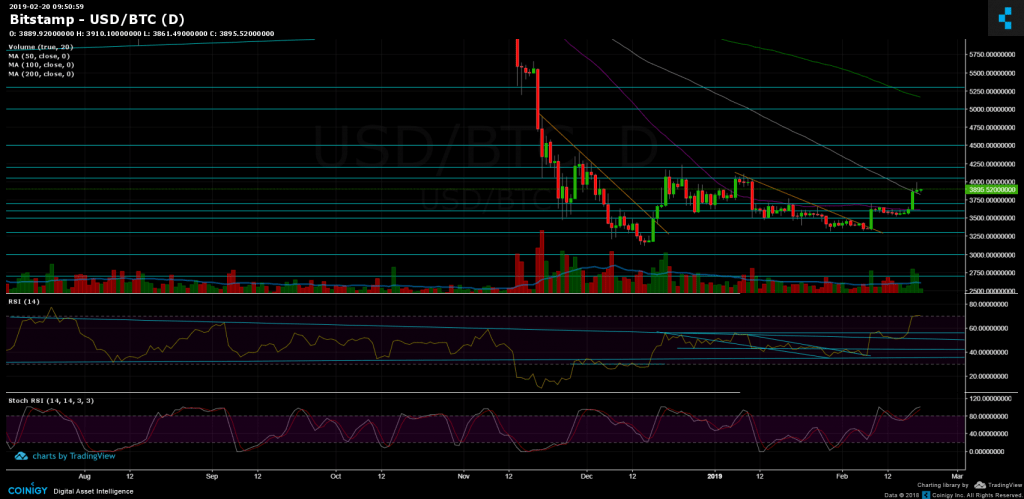
– Looking at the daily chart’s RSI: This is a breakout! The long-term descending trend-line had been breached up nicely and sharply. The RSI hadn’t seen those high levels since July 2018.
– Following the action, the trading volume is high in green. This is a bullish sign.
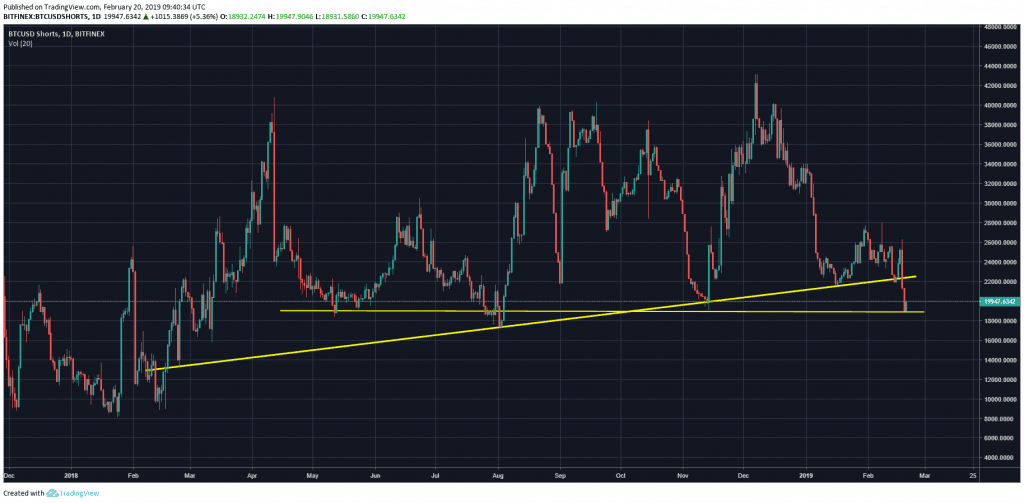
– BitFinex’s open short positions: After breaking down the long-term ascending trend-line, The shorts had reached a horizontal support level around 19,000. This was also the number of shorts on November 14, 2018, just before Bitcoin broke down the significant level of $6000 (along with breaking down the bearish triangle).
The BTC Longs chart reveals closing of long positions. This reduces the thought of a market price manipulation (since it’s a healthy traders’ behavior).
As can be seen on the chart below, support holds and since encountering the line – the number of shorts slowly climbs.
BTC/USD BitStamp 4-Hour chart
BTC/USD BitStamp 1-Day chart
BTC Open Short Positions (BitFinex)
The post Bitcoin Price Analysis Feb.20: Following Massive Gains, Could BTC Break-up $4000? appeared first on CryptoPotato.