Bitcoin Price Analysis Feb.17: BTC Is Facing $3600 (Again) And Could Turn Short-Term Bullish
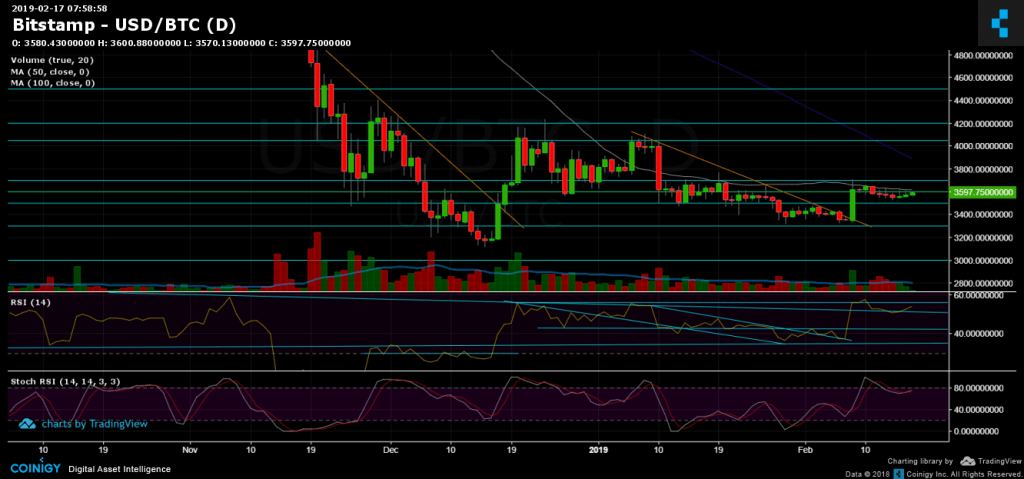
For the past nine days, Bitcoin has been consolidating between the tight range of $3550 and $3650.
The overall picture hadn’t changed and is still under bearish conditions. However, two signs could change the bigger picture for the near short-term.
Regarding the open short positions, after reaching the long-term trend-line, there was a possibility of a BTC price manipulation, as happened last time when the support was tested during January 6. In this field, since our past analysis, we’ve seen a slight recovery of the shorts.
The chances for a manipulation (or “Bart”) had decreased, but the possibility still exists.
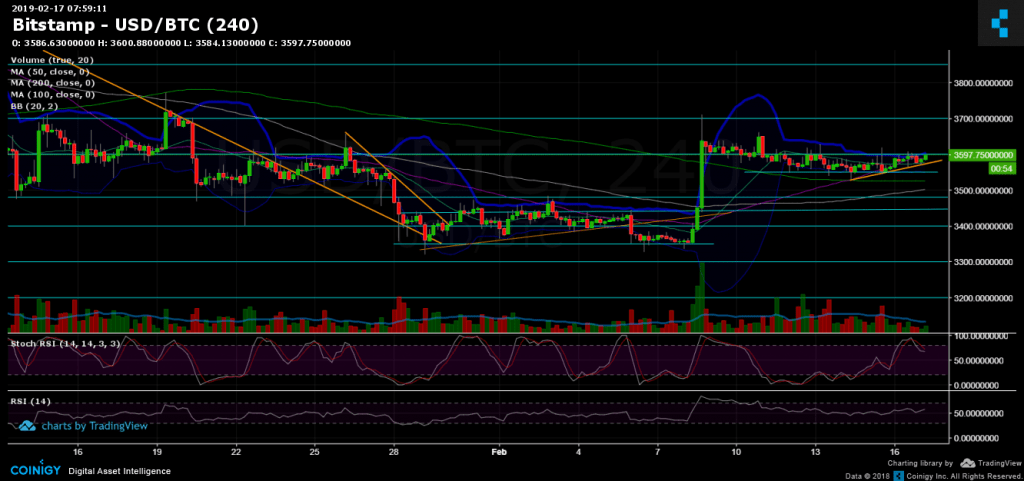
Looking at the 1-day & 4-hour charts
- Bollinger Bands are very tight. Hence, we are expecting a move soon.
- The 4-hour chart is forming a bullish triangle for the past three days. The formation will play-out in case of a break-up of the $3600 level followed by a high volume of buyers. A more bullish mid-term move will be in case of breaking up the crucial 50-days moving average line on the daily chart (marked in white, currently around $3620).
- The second bullish sign might be the daily chart’s RSI: After the RSI had reached support of the long-term descending trend-line, the direction had turned back up, facing now the critical 56 RSI levels. In case of a breakout, this could lead to a significant bullish move.
- Support and resistance areas: From above, the $3600 – $3620 resistance area (as mentioned above), further lies the $3700 and $3850 levels.
- From below: There is a nearby descending trend-line (currently around $3575), further down is the $3480 – $3500 significant support area. Below is the $3400 level.
- The trading volume is average to the last period, not substantial.
- As mentioned, BitFinex’s open short positions slightly increased to 23.70K BTC of open positions, following the analysis above.
BTC/USD BitStamp 4-Hour chart
BTC/USD BitStamp 1-Day chart
The post Bitcoin Price Analysis Feb.17: BTC Is Facing $3600 (Again) And Could Turn Short-Term Bullish appeared first on CryptoPotato.