Bitcoin Price Analysis: Despite The Bearish Trajectory, These Signs Point Short-Term Bullish For BTC
Over the past days, we saw the Bitcoin price decreasing slowly, but staying steady around the $8700 – $8800 price range.
Ignoring the “Bart” pattern price manipulation over the weekend, Bitcoin had been trading at the mentioned range over the past four days.
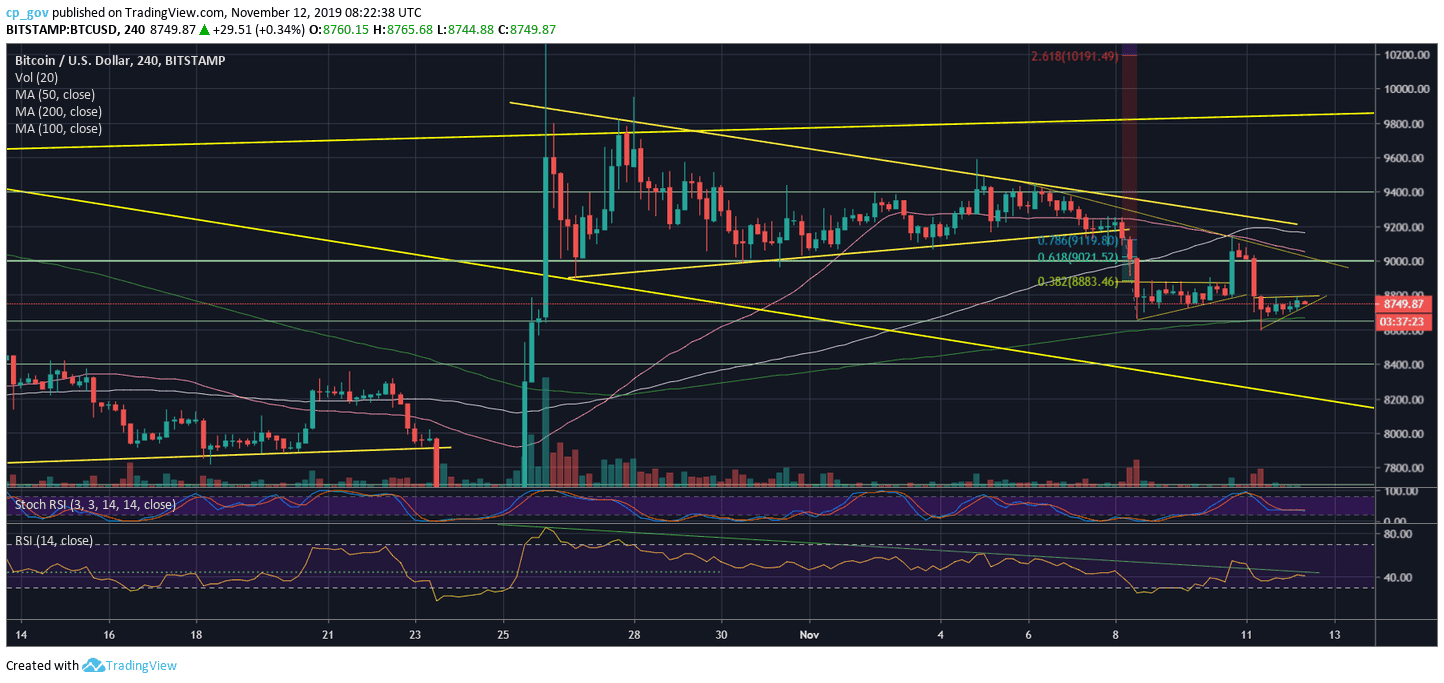
On our recent Bitcoin price analysis, we had mentioned precisely where the positive correction could reach out: “In my opinion, the correction can also reach $9000 – $9100 (Fibonacci levels 61.8% and 78.6%).”
As could be seen, the $9150 was the 24-hour high from Sunday, and that was not a coincidence: on the 4-hour, it’s exactly where the MA-50 line (marked pink) intersects the MA-100 (white line) along with the Fibonacci retracement level of 78.6% and a descending trend-line.
Even though Bitcoin is producing a clear lower highs trajectory on the 4-hour chart (which tends to be bearish), there are some signs which could easily turn to a bullish price action.
However, Bitcoin will have to invalidate this trajectory and break up the $9150 Sunday’s high in order to prove this.
Total Market Cap: $240 billion
Bitcoin Market Cap: $159 billion
BTC Dominance Index: 66.0%
*Data by CoinGecko
Key Levels to Watch
– Support/Resistance: From above, the nearby resistance lies at $8800, before the above-mentioned resistance area of $9000 – $9150, which contains the 4-hour’s MA-50, MA-100, and a descending trend-line.
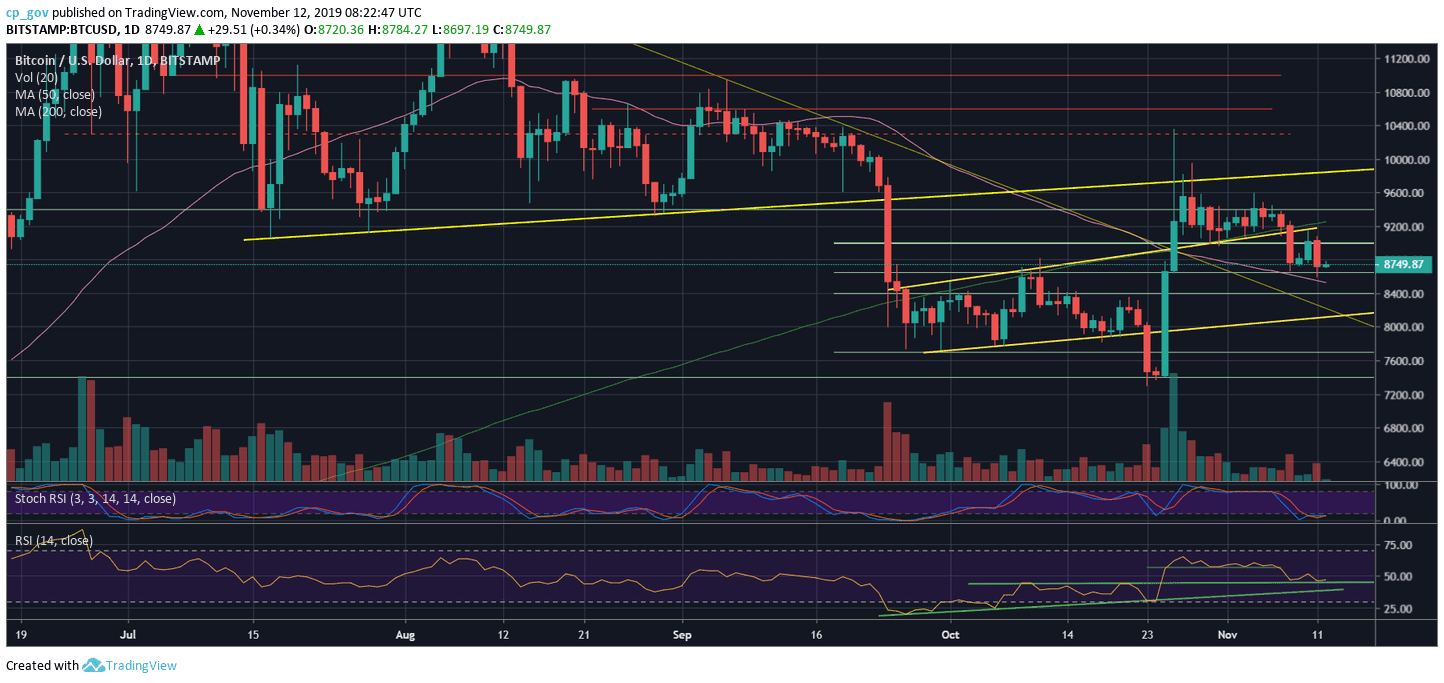
Further above is the significant 200-days moving average line (marked by a light green line on the daily chart), roughly around $9250. Higher above lies the substantial resistance area of $9400 – $9500.
From below, the first support lies at the mini-triangles’ 4-hour descending trend-line (around the current price level). Breaking down and the next support is $8600 – $8650 (yesterday’s low along with 4-hour’s MA-200). Further down is the 50-days moving average line at $8500 and horizontal support at $8400. Below is $8200 along with the mid-term ascending trend-line (shown on the following daily chart).
The RSI Indicator: The daily RSI is showing strength, maintaining the 44 horizontal supporting line.
Both the 4-hour and the daily chart are in their oversold territory, as can be concluded by looking at the Stochastic RSI oscillator. This can turn bullish and fuel the next price rise.
Trading volume: Since the price decline, which took place last Friday, the volume is decreasing and is considered below average.
BTC/USD BitStamp 4-Hour Chart
BTC/USD BitStamp 1-Day Chart
The post Bitcoin Price Analysis: Despite The Bearish Trajectory, These Signs Point Short-Term Bullish For BTC appeared first on CryptoPotato.