Bitcoin Price Analysis Dec.7: Black Friday Round 2 – BTC’s New Annual Low
Black Friday was a short while ago. However, cryptocurrencies want to celebrate the sale prices’ holiday one more time.
We talked about this bear market three weeks ago before the mess was starting. When our prediction published, Bitcoin’s price was $6500. We all couldn’t believe we’ll see the prediction’s targets reach in less than a month. Bitcoin is very close to complete the targets at $2700 – $3000.
The only positive side here is that when looking at the structure of a market cycle, this is precisely how the last stage, the capitulation, looks like. The downside is that we can’t really estimate when this capitulation nightmare will end, and Bitcoin will have green days again.
Looking at the 1-day & 1-hour charts
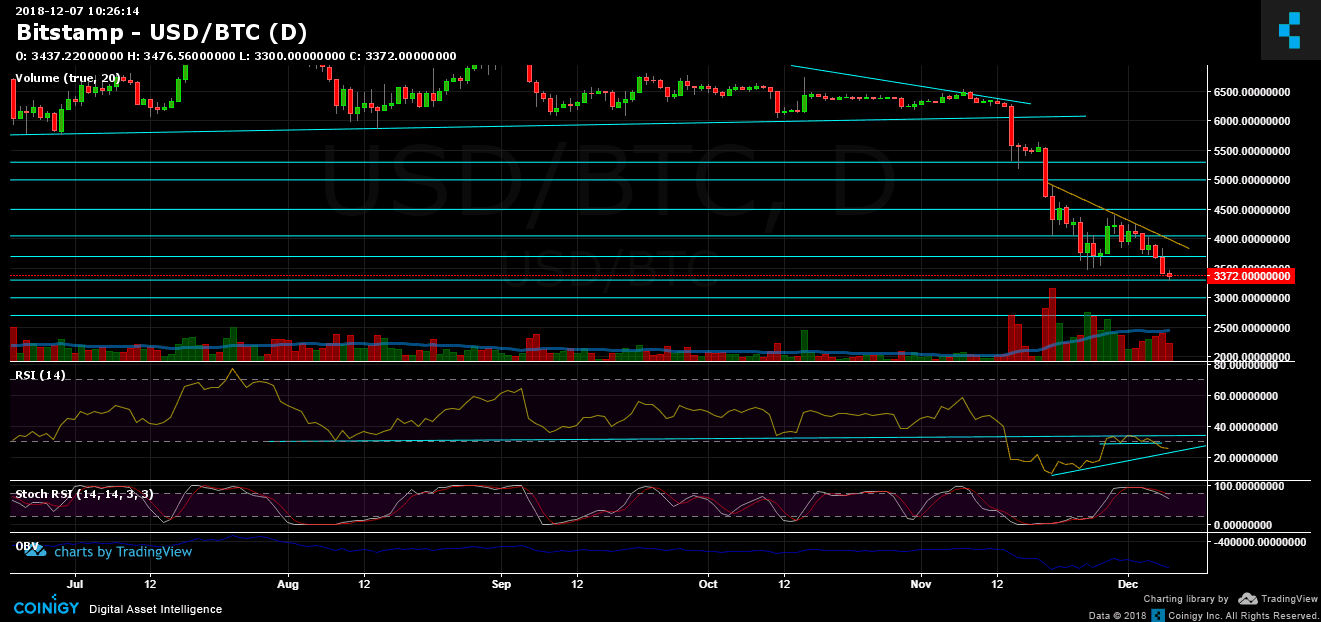
- Congrats. We have a new annual low. After breaking the $3500 – which is the prior record, Bitcoin marked the $3300 as the new yearly low. We mentioned this support level before.
- The next significant support lies around $3000 – $3100, before getting to the $2700 – $2900 support zone.
-
The daily chart RSI tells it all: look at the following daily RSI:
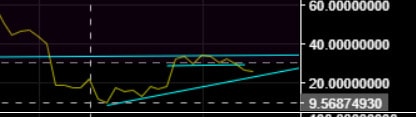
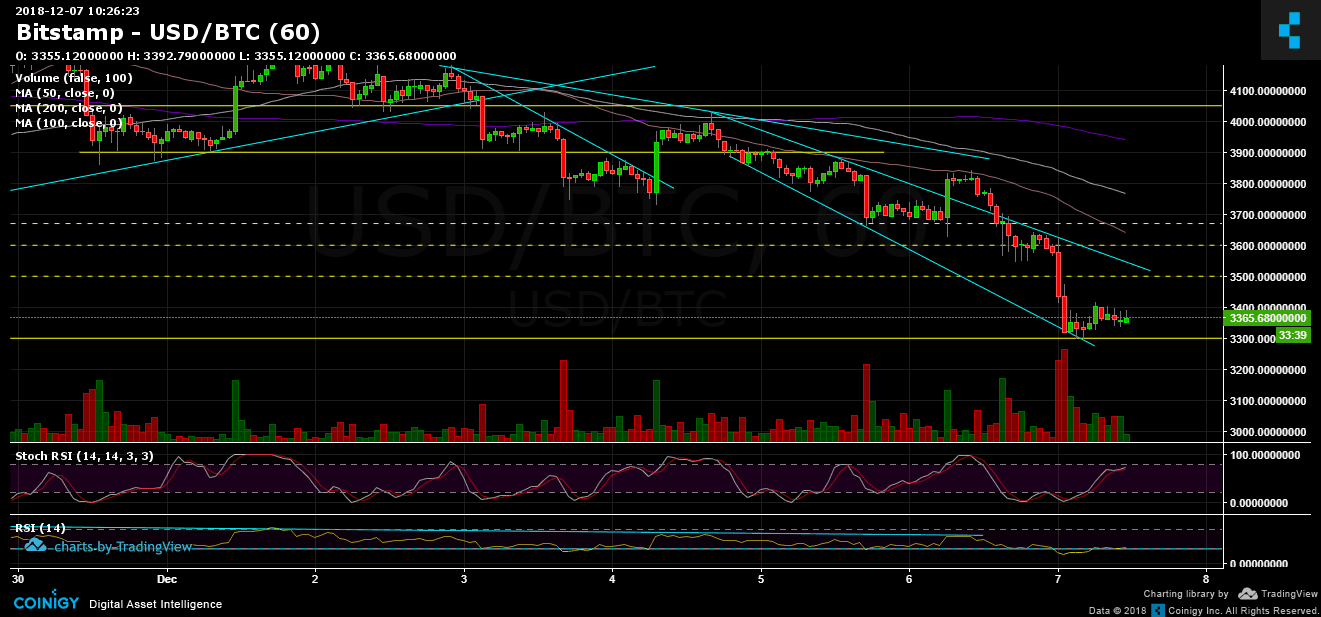
After two times where it got supported, the third time the RSI broke the 28.5 support line and created a violent move down. The RSI is getting closer to the ascending trend-line. This could indicate on a possible bears’ break and there might be checking the 28.5 to confirm it as a resistance level. Bitcoin might confirm $3500 as a resistance level before continuing down. - The short-term: The hourly chart movement reveals a wedge pattern. $3300 is the bottom line of it. In the above correction, I can only assume Bitcoin will meet with the upper line of the wedge around $3500.
- In case the correction lasts longer, the targets could be $3600, $3700 and $3850 (which this could be on the daily chart’s descending mid-term trend-line).
- As expected, BitFinex’s open short positions have increased sharply to 39.9K BTC.
BTC/USD BitStamp 1-Hour chart
BTC/USD BitStamp 1-Day chart
Cryptocurrency charts by TradingView. Technical analysis tools by Coinigy.
The post Bitcoin Price Analysis Dec.7: Black Friday Round 2 – BTC’s New Annual Low appeared first on CryptoPotato.