Bitcoin Price Analysis Dec.4: Testing the $4000 support-turned resistance area from below
Over the past day and since breaking down the ascending channel, Bitcoin had lost the $3900 support level in its way to find the current low around the $3700 support mark.
There, buyers stepped in to produce a beautiful $250 one-hour green candle along with breaking out the hourly chart’s descending trend-line.
As a result, Bitcoin is now consolidating on top the $3900 level, where it was just a day ago.
For the mid-long term, I don’t see any change of the bearish momentum. Bitcoin might re-test the $4050 critical area, in order to confirm the level as a support-turned resistance, before turning bearish again.
To start thinking bullish, I would look for a breakout of the $4250 zone, which is the major prior high that was reached three days ago.
An issue to consider has risen lately following a very rare $257 Million worth of Bitcoin’s transaction. More info about the breaking news can be read here.
Looking at the 1-day & 1-hour charts
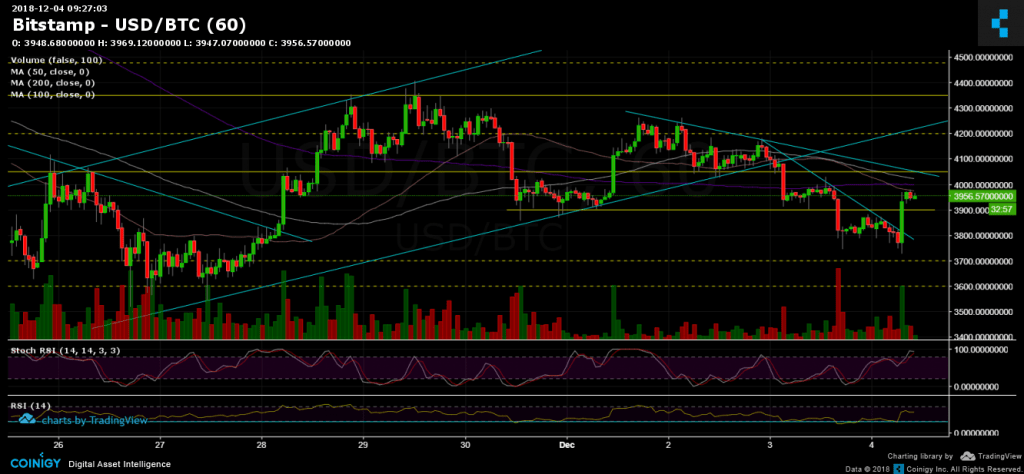
- The short-term: The hourly chart’s Stochastic RSI is about to cross at the overbought area. This might indicate on a possible correction down.
- From the bear side, the next support levels lie at $3900, $3800 and $3700 (the daily low), before getting to the yearly low’s area at $3500.
- From the bull side, the next major resistance level is around $4050, afterward is the $4250, and then the $4350 level.
- The trading volume is still low, compared to last week’s volume.
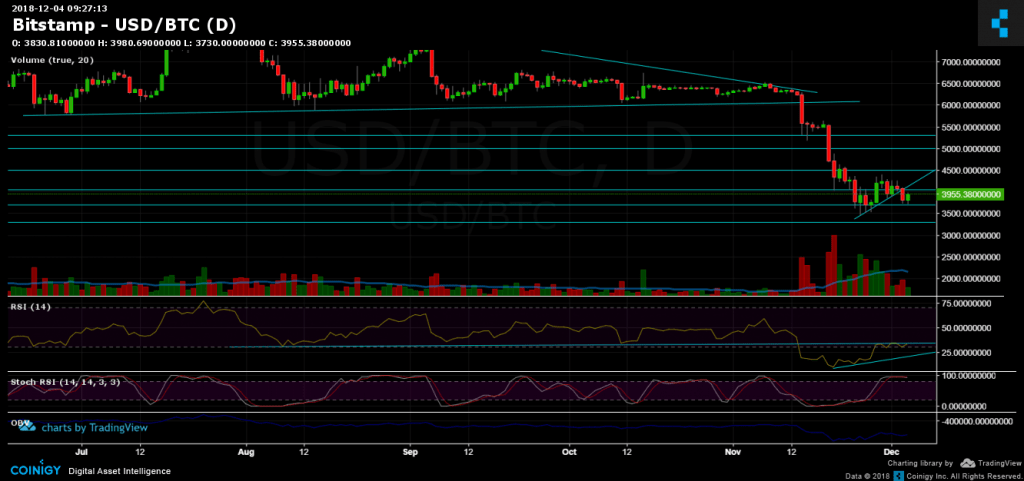
- The daily chart’s RSI indicator: The important indicator is testing the support turned resistance RSI line for the third time during the past week. Breaking the above line could signal a short to mid-term bullish movement while failing to do so is likely to send Bitcoin to find new annual lows.
- The daily chart’s Stochastic RSI oscillator is still about to cross at the overbought area.
- BitFinex’s open short positions have slightly decreased to 35.5K. We discussed the option of a short squeeze here.
BTC/USD BitStamp 1-Hour chart
BTC/USD BitStamp 1-Day chart
Cryptocurrency charts by TradingView. Technical analysis tools by Coinigy.
The post Bitcoin Price Analysis Dec.4: Testing the $4000 support-turned resistance area from below appeared first on CryptoPotato.