Bitcoin Price Analysis Dec.28: Sideways Done As BTC Breaks Down To Retest $3600
Yesterday we mentioned about the range Bitcoin was trading at for a couple of days: $3700 from below and $3850 from above.
We also mentioned that we expect a breakout to either direction very soon. As you all can see, Bitcoin broke down the $3700 level in its way to test the next resistance which lies at $3600.
So far, the significant support level of $3600 holds up. But, and as said before, the bearish momentum is not over yet. Hence, the chances of a break down are higher than those for a reversal here.
Looking at the 1-day & 4-hour charts
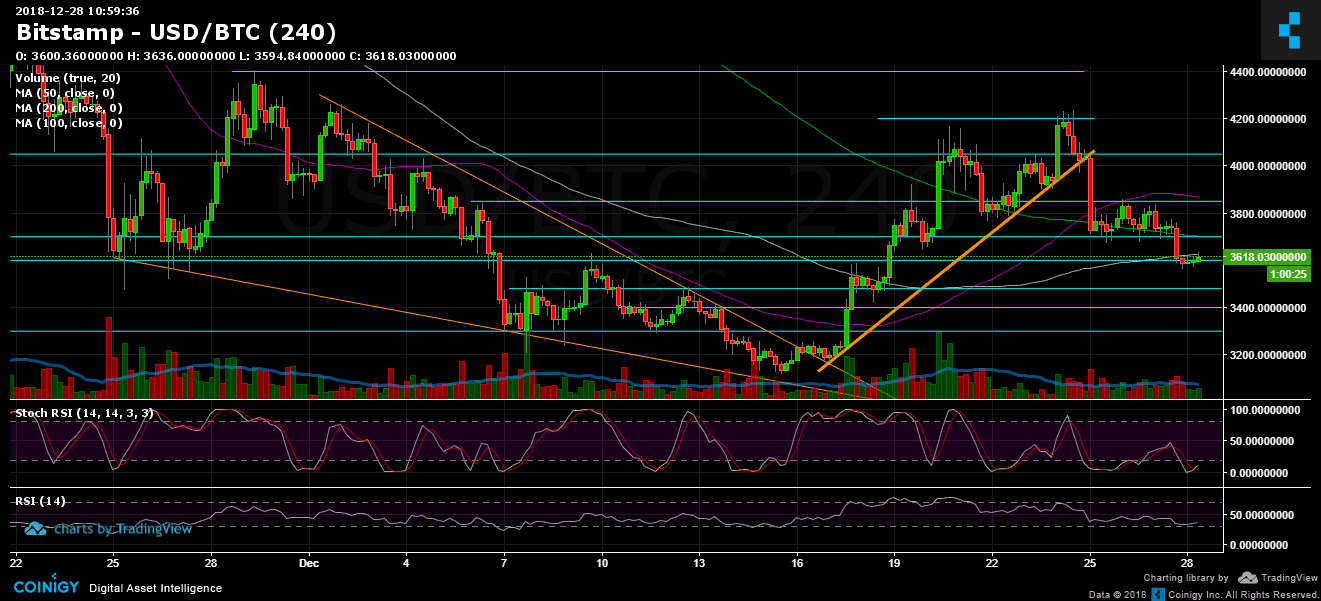
- As expected in the case of breaking down the $3700 support, Bitcoin went down quickly to re-test the next significant support level at $3600.
- Breaking down the $3600 and Bitcoin is likely to retest the $3480 support level, $3400 and the strong support at $3300.
- From above, $3700 is now a support-turned resistance level, along with the 200 days moving average line (marked in light green on the 4-hour chart). From above, the next resistance lies at $3850 – resistance along with 50 days moving average line (marked in purple).
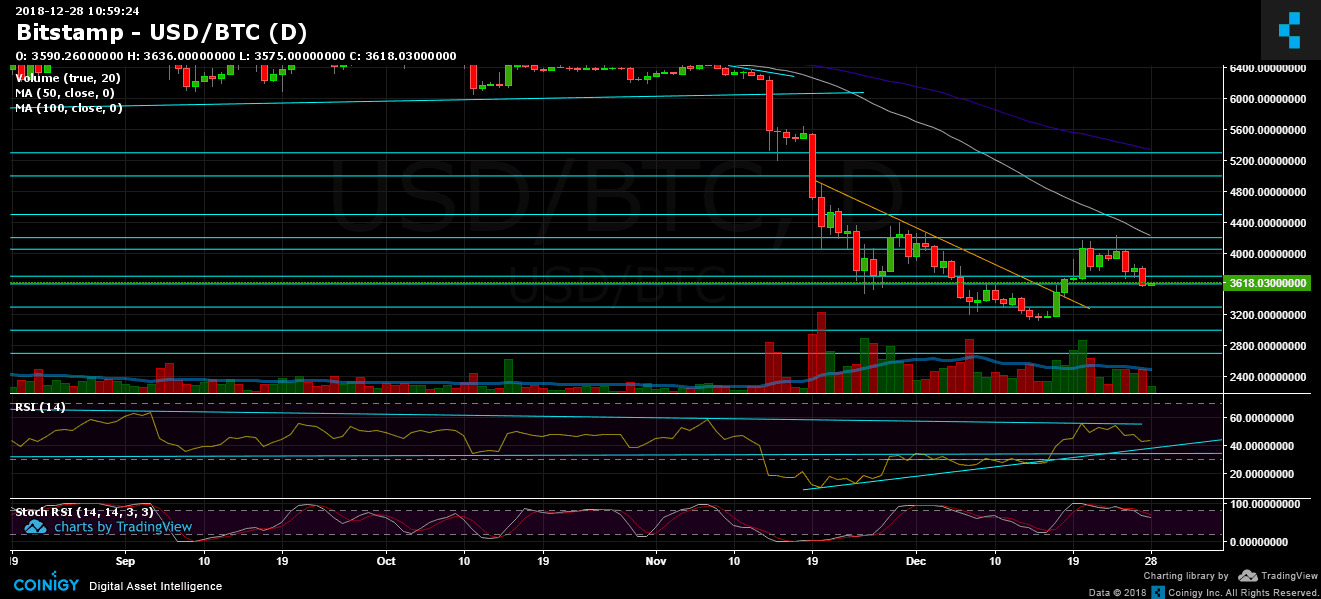
- Looking at the daily chart’s RSI: This is interesting. There is still more room for the RSI to go down untill reaching the ascending mid-term trendline on the RSI chart. That ascending line is crucial to hold as support for the long-term, as we see something called Negative Diversions: The asset, Bitcoin in the case, is going down while the RSI is going up at the same range. This might tell of a change in momentum for the longer period.
- Stochastic RSI oscillator of the daily chart had recently crossed over at the overbought level; this oscillator supports the option of a retest of lower levels.
- The trading volume is still relatively low, this is likely because of the holidays.
- BitFinex’s open short positions had increased to 32.3K BTC. Yesterday the positions were at 31K, their monthly low.
BTC/USD BitStamp 4-Hour chart
BTC/USD BitStamp 1-Day chart
The post Bitcoin Price Analysis Dec.28: Sideways Done As BTC Breaks Down To Retest $3600 appeared first on CryptoPotato.