Bitcoin Price Analysis Dec.18: The Next Major Obstacle For BTC
Following yesterday’s analysis and after breaking up the falling wedge pattern, Bitcoin had made a significant bullish move. It doesn’t mean it’s over yet. The next day or two will be critical to determine if the correction can continue or else, lose momentum back to the $3000 area.
As mentioned yesterday, the $3450 – $3500 is indeed a substantial resistance to overcome.
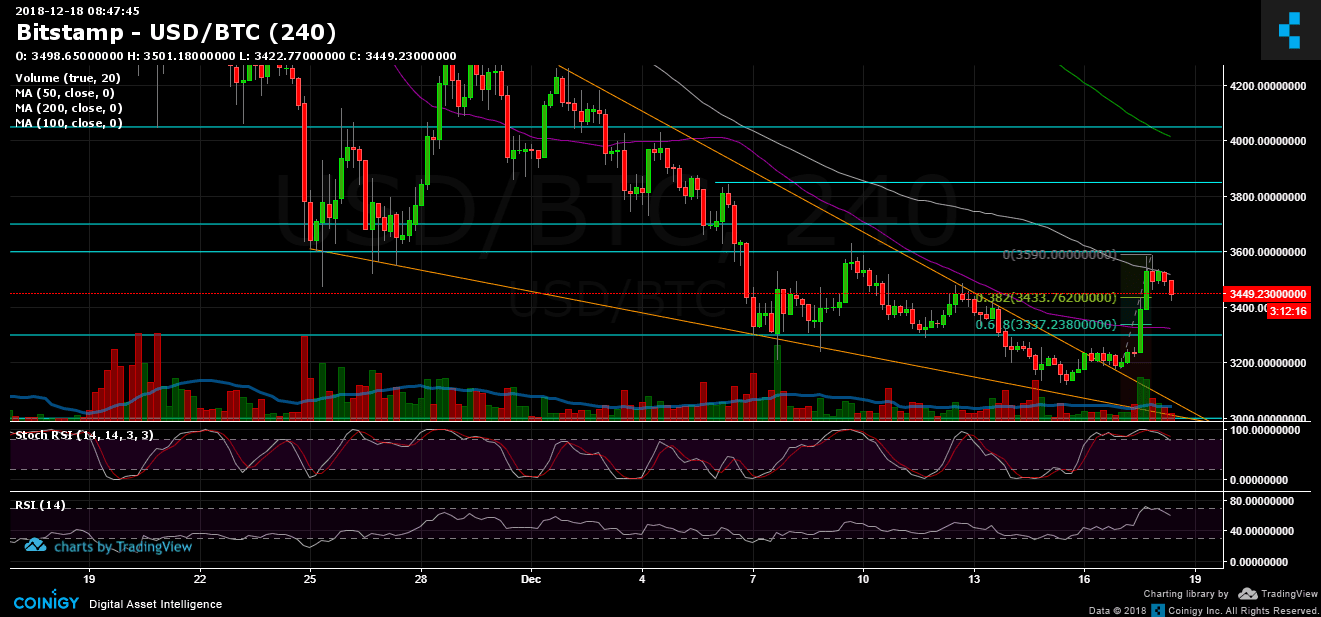
Bitcoin has reached the 100 days moving average resistance line (marked white on the 4-hour following chart). To remember when was the last time BTC was above this line we need to go way back to around September 11. For more than three months Bitcoin couldn’t manage to breach this resistance line, and now it’s facing it again, as the first obstacle in Bitcoin’s way up.
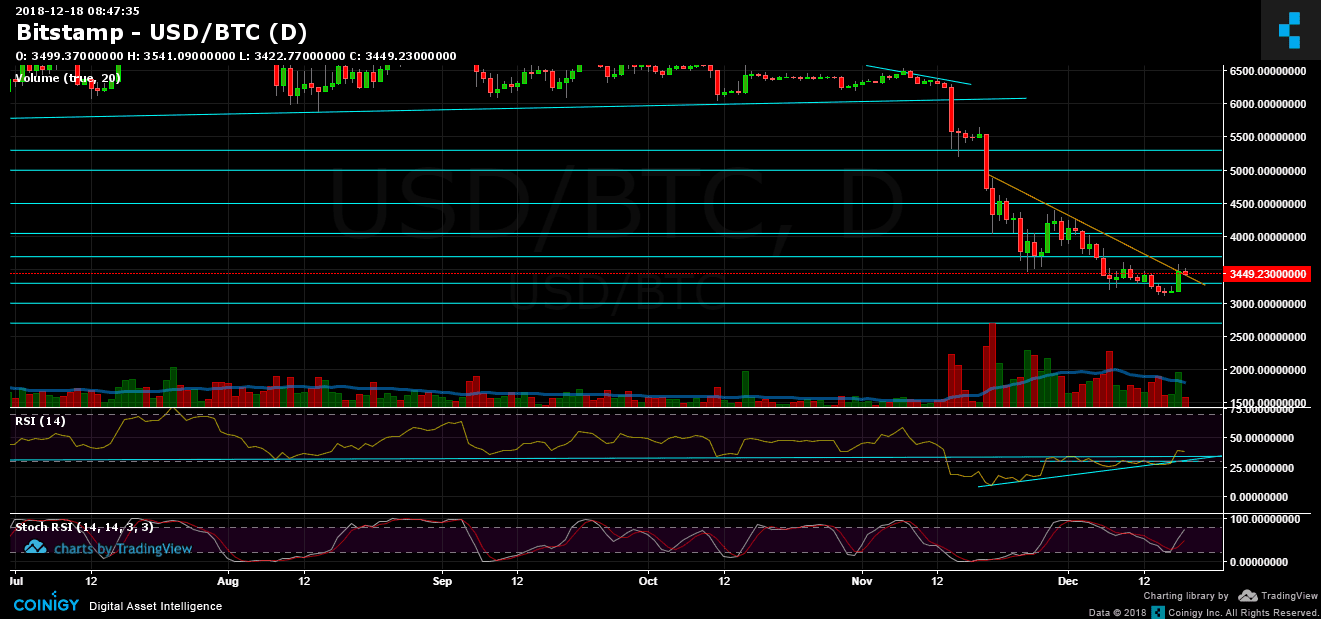
For the longer term, in my opinion, the critical level is the $4400 zone. At that level was the last significant Bitcoin’s high on the daily chart.
Looking at the 1-day & 4-hour charts
- Looking on the daily chart: today’s Japanese candle will determine whether or not Bitcoin will continue its momentum to stay above the descending trend-line (the one marked in orange on the daily chart, this line was forming since November 20).
- It looks like Bitcoin has the right keys to continue up, at least to the $3600 – $3700 area: The daily trading volume is the highest of the past week, the RSI indicator looks bullish after breaking up the long-term trend line.
- However, Stochastic RSI oscillator of the 4-hour chart is at its overbought area, so we might see a correction to re-test prior support levels: Fibonacci retracement 38.2% lies around $3430, while 61.8% lies around $3340 (along with the 50 days moving average line). The two above levels are a possible healthy correction before continuation to the bullish movement.
- As mentioned, resistance area lies where Bitcoin is currently at, $3450 – $3500. The next significant resistance levels are $3600, $3700 and the prior high of $3850.
- Breaking down the $3300 might increase the chances of seeing new annual lows (below $3100).
- Along with the bulls, BitFinex’s open short positions had decreased sharply to 35K BTC open positions, after reaching 40K just before yesterday’s squeeze.
BTC/USD BitStamp 4-Hour chart
BTC/USD BitStamp 1-Day chart
Cryptocurrency charts by TradingView. Technical analysis tools by Coinigy.
The post Bitcoin Price Analysis Dec.18: The Next Major Obstacle For BTC appeared first on CryptoPotato.