Bitcoin Price Analysis: BTC Trading In A Tight Range, Huge Move Coming Up Soon?
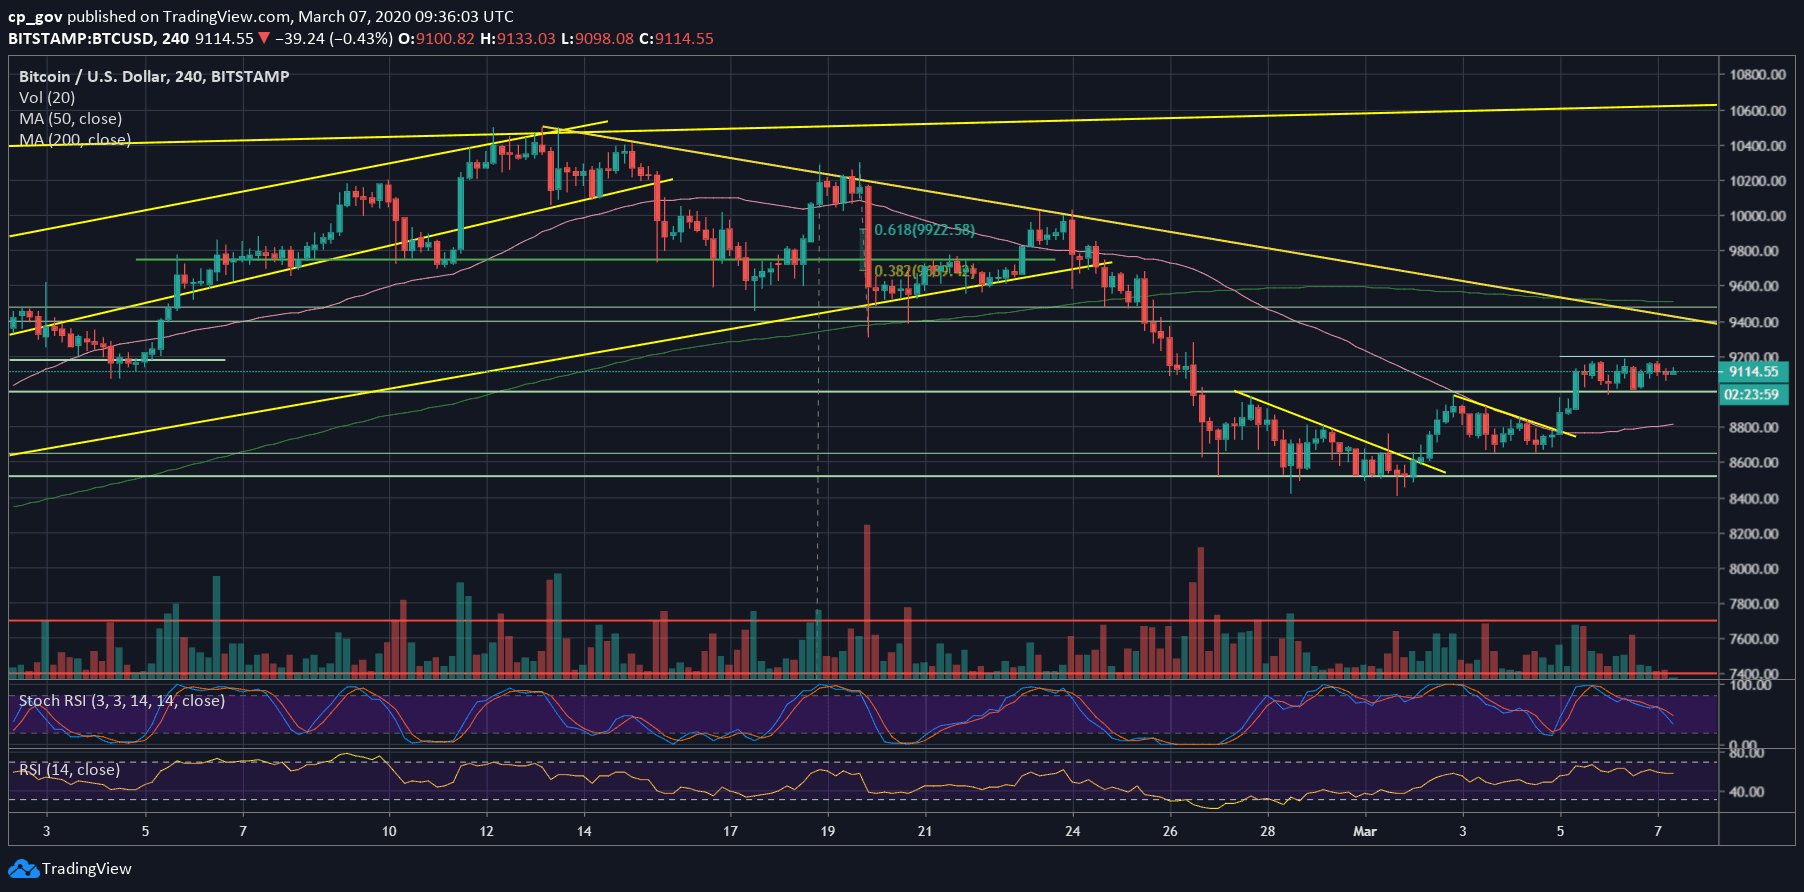
Last Thursday, Bitcoin broke out a triangle pattern, the second in the same week, as can be seen on the following 4-hour chart. The breakout initiated an immediate $400 price gain, surpassing the $9000 benchmark level.
Over the past two days, after breaking above the $9K mark, we saw Bitcoin trading in a tight range between $9000 and $9200.
While Wall Street and the global markets were crashing further 5% over the past two days of trading, Bitcoin successfully disconnected its recent correlation to the markets, and now all eyes are on the primary cryptocurrency – is Bitcoin a real safe-haven like Gold or not?
Back to the charts: the recent declining amount of trading volume, along with the consolidation of the RSI indicator around 50, likely to predict a huge move coming up.
It’s still early to say whether the coming-up move will be to the bullish or bearish direction; however, a break above $9200 or below $9000 is likely to decide the short term for Bitcoin price.
Total Market Cap: $263.7 billion
Bitcoin Market Cap: $166.7 billion
BTC Dominance Index: 63.2%
*Data by CoinGecko
Key Levels To Watch & Next Possible Targets
– Support/Resistance levels: As mentioned above, Bitcoin is trading between $9000 and $9200.
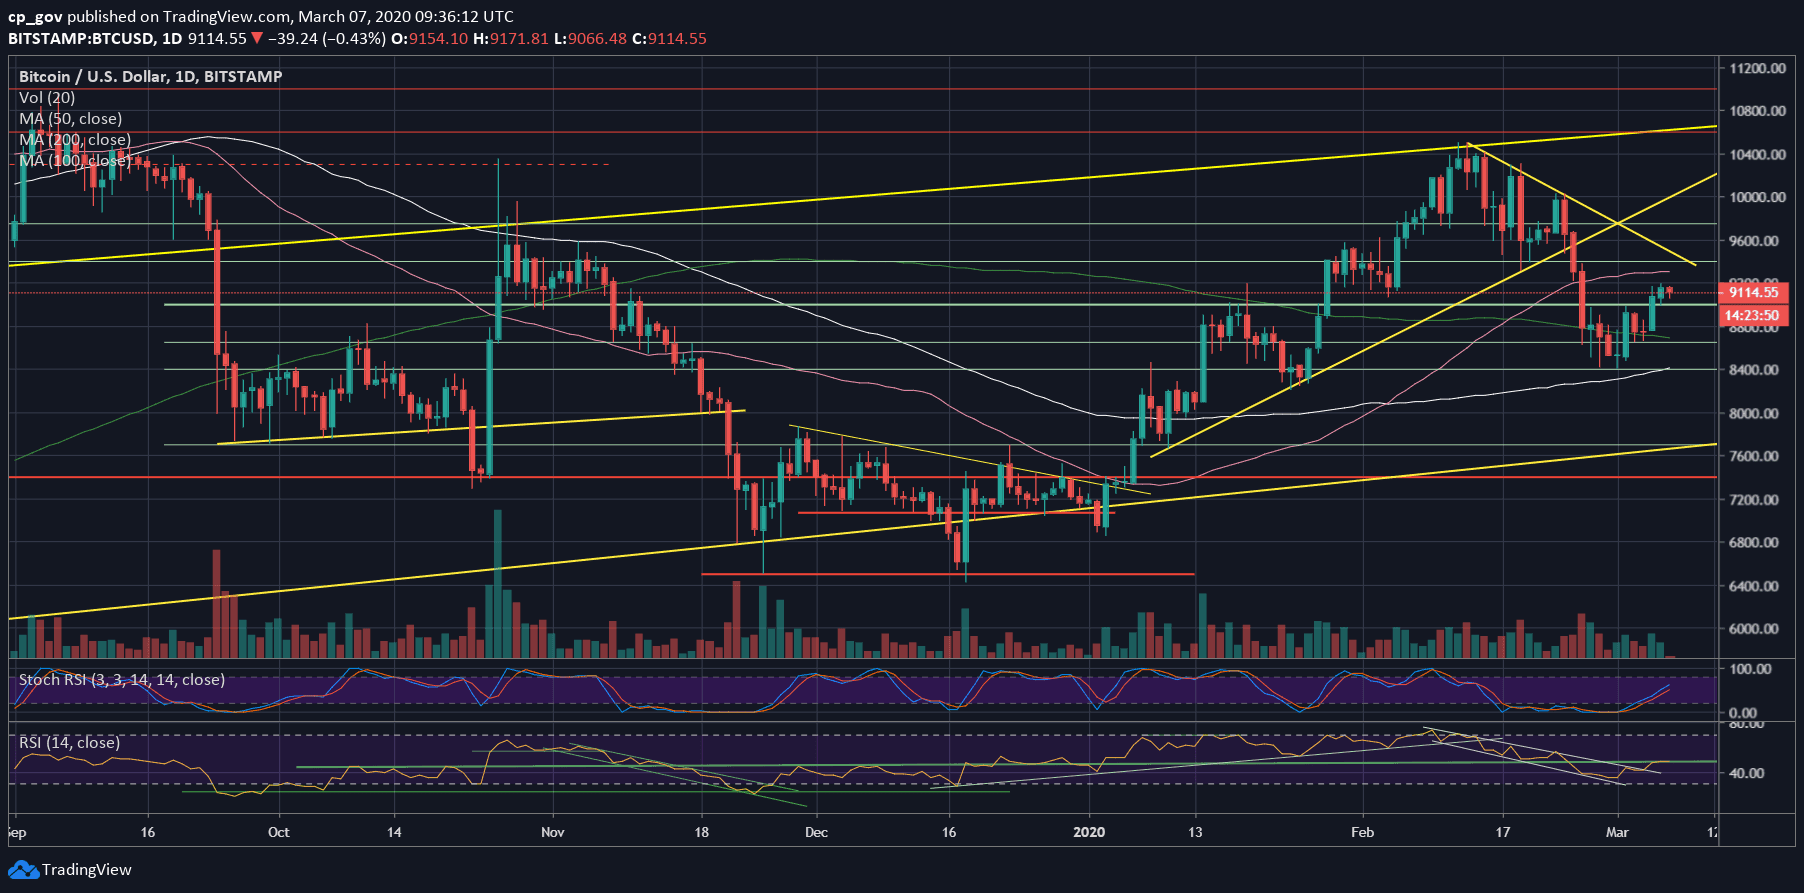
From above, the first level of resistance is $9200. Further above is $9300, which is also the 50-days moving average line (marked pink, ~$9310), along with a mid-term descending trend-line marked on the daily chart. In case the last two are broken up, then the next resistance is $9400 and $9600.
From below, the first level of support is the $9000 mark. Further below lies $8800 and $8700, which is also where lies the 200-days moving average line (marked light green on the following daily chart). The next support lies at $8650 (the low from the past week), before the $8500 support level.
– The RSI Indicator: As mentioned above, the momentum indicator is stuck at the 50 crucial level. This is a turning point between a bearish and bullish momentum.
– Trading volume: As discussed above, the trading volume is declining, indicating a possible coming up move.
BTC/USD BitStamp 4-Hour Chart
BTC/USD BitStamp 1-Day Chart
The post Bitcoin Price Analysis: BTC Trading In A Tight Range, Huge Move Coming Up Soon? appeared first on CryptoPotato.