Bitcoin Price Analysis: BTC to $8K Or $10K? That’s the Question Following Zero Volatility
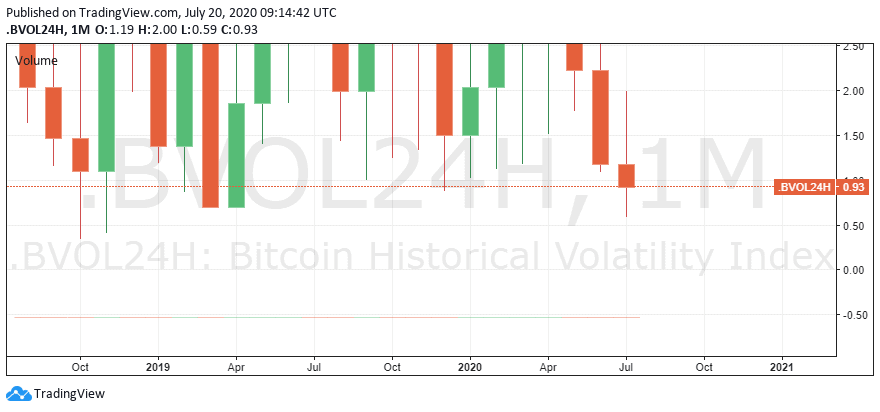
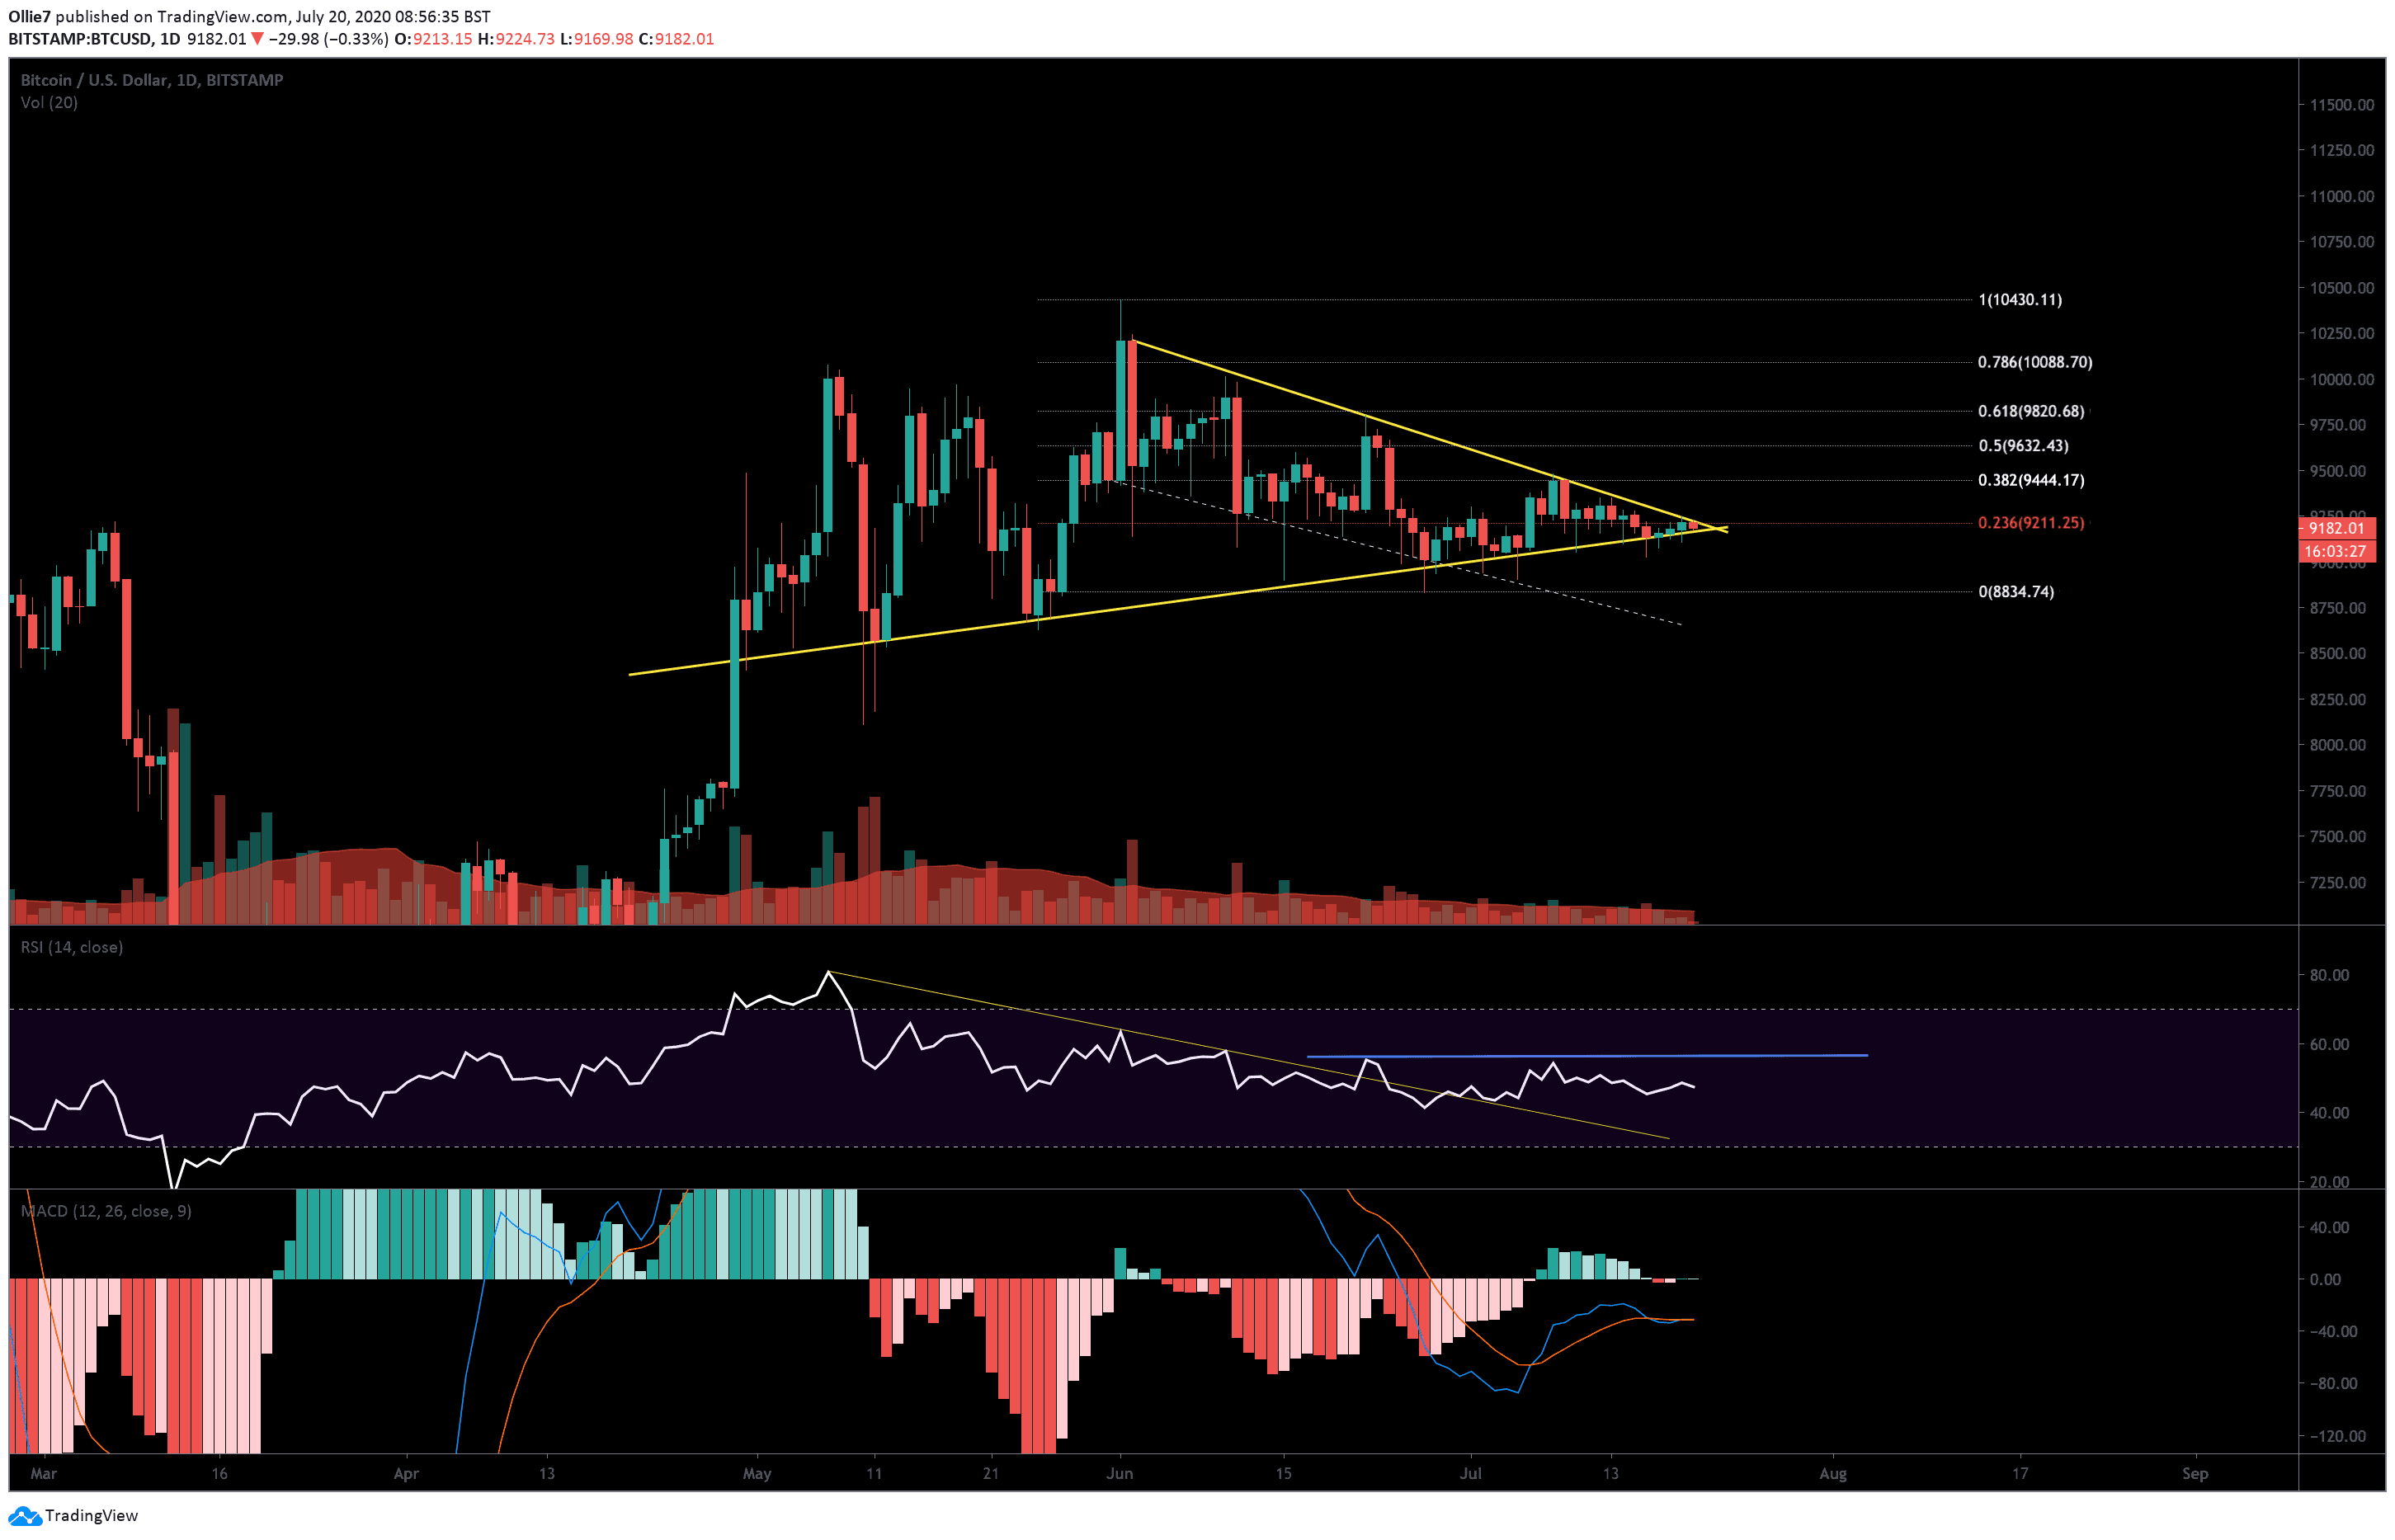
Today, BTC/USD price appears to have reached maximum consolidation between two long-standing trend lines (see daily chart below). Volatility has also continued to diminish further over the weekend, with the Bollinger bandwidth now at 0.1 on the 4-Hour chart.
These two factors suggest that a major move could take place over the course of today’s trading session. But which way will Bitcoin break out?
The Technicals
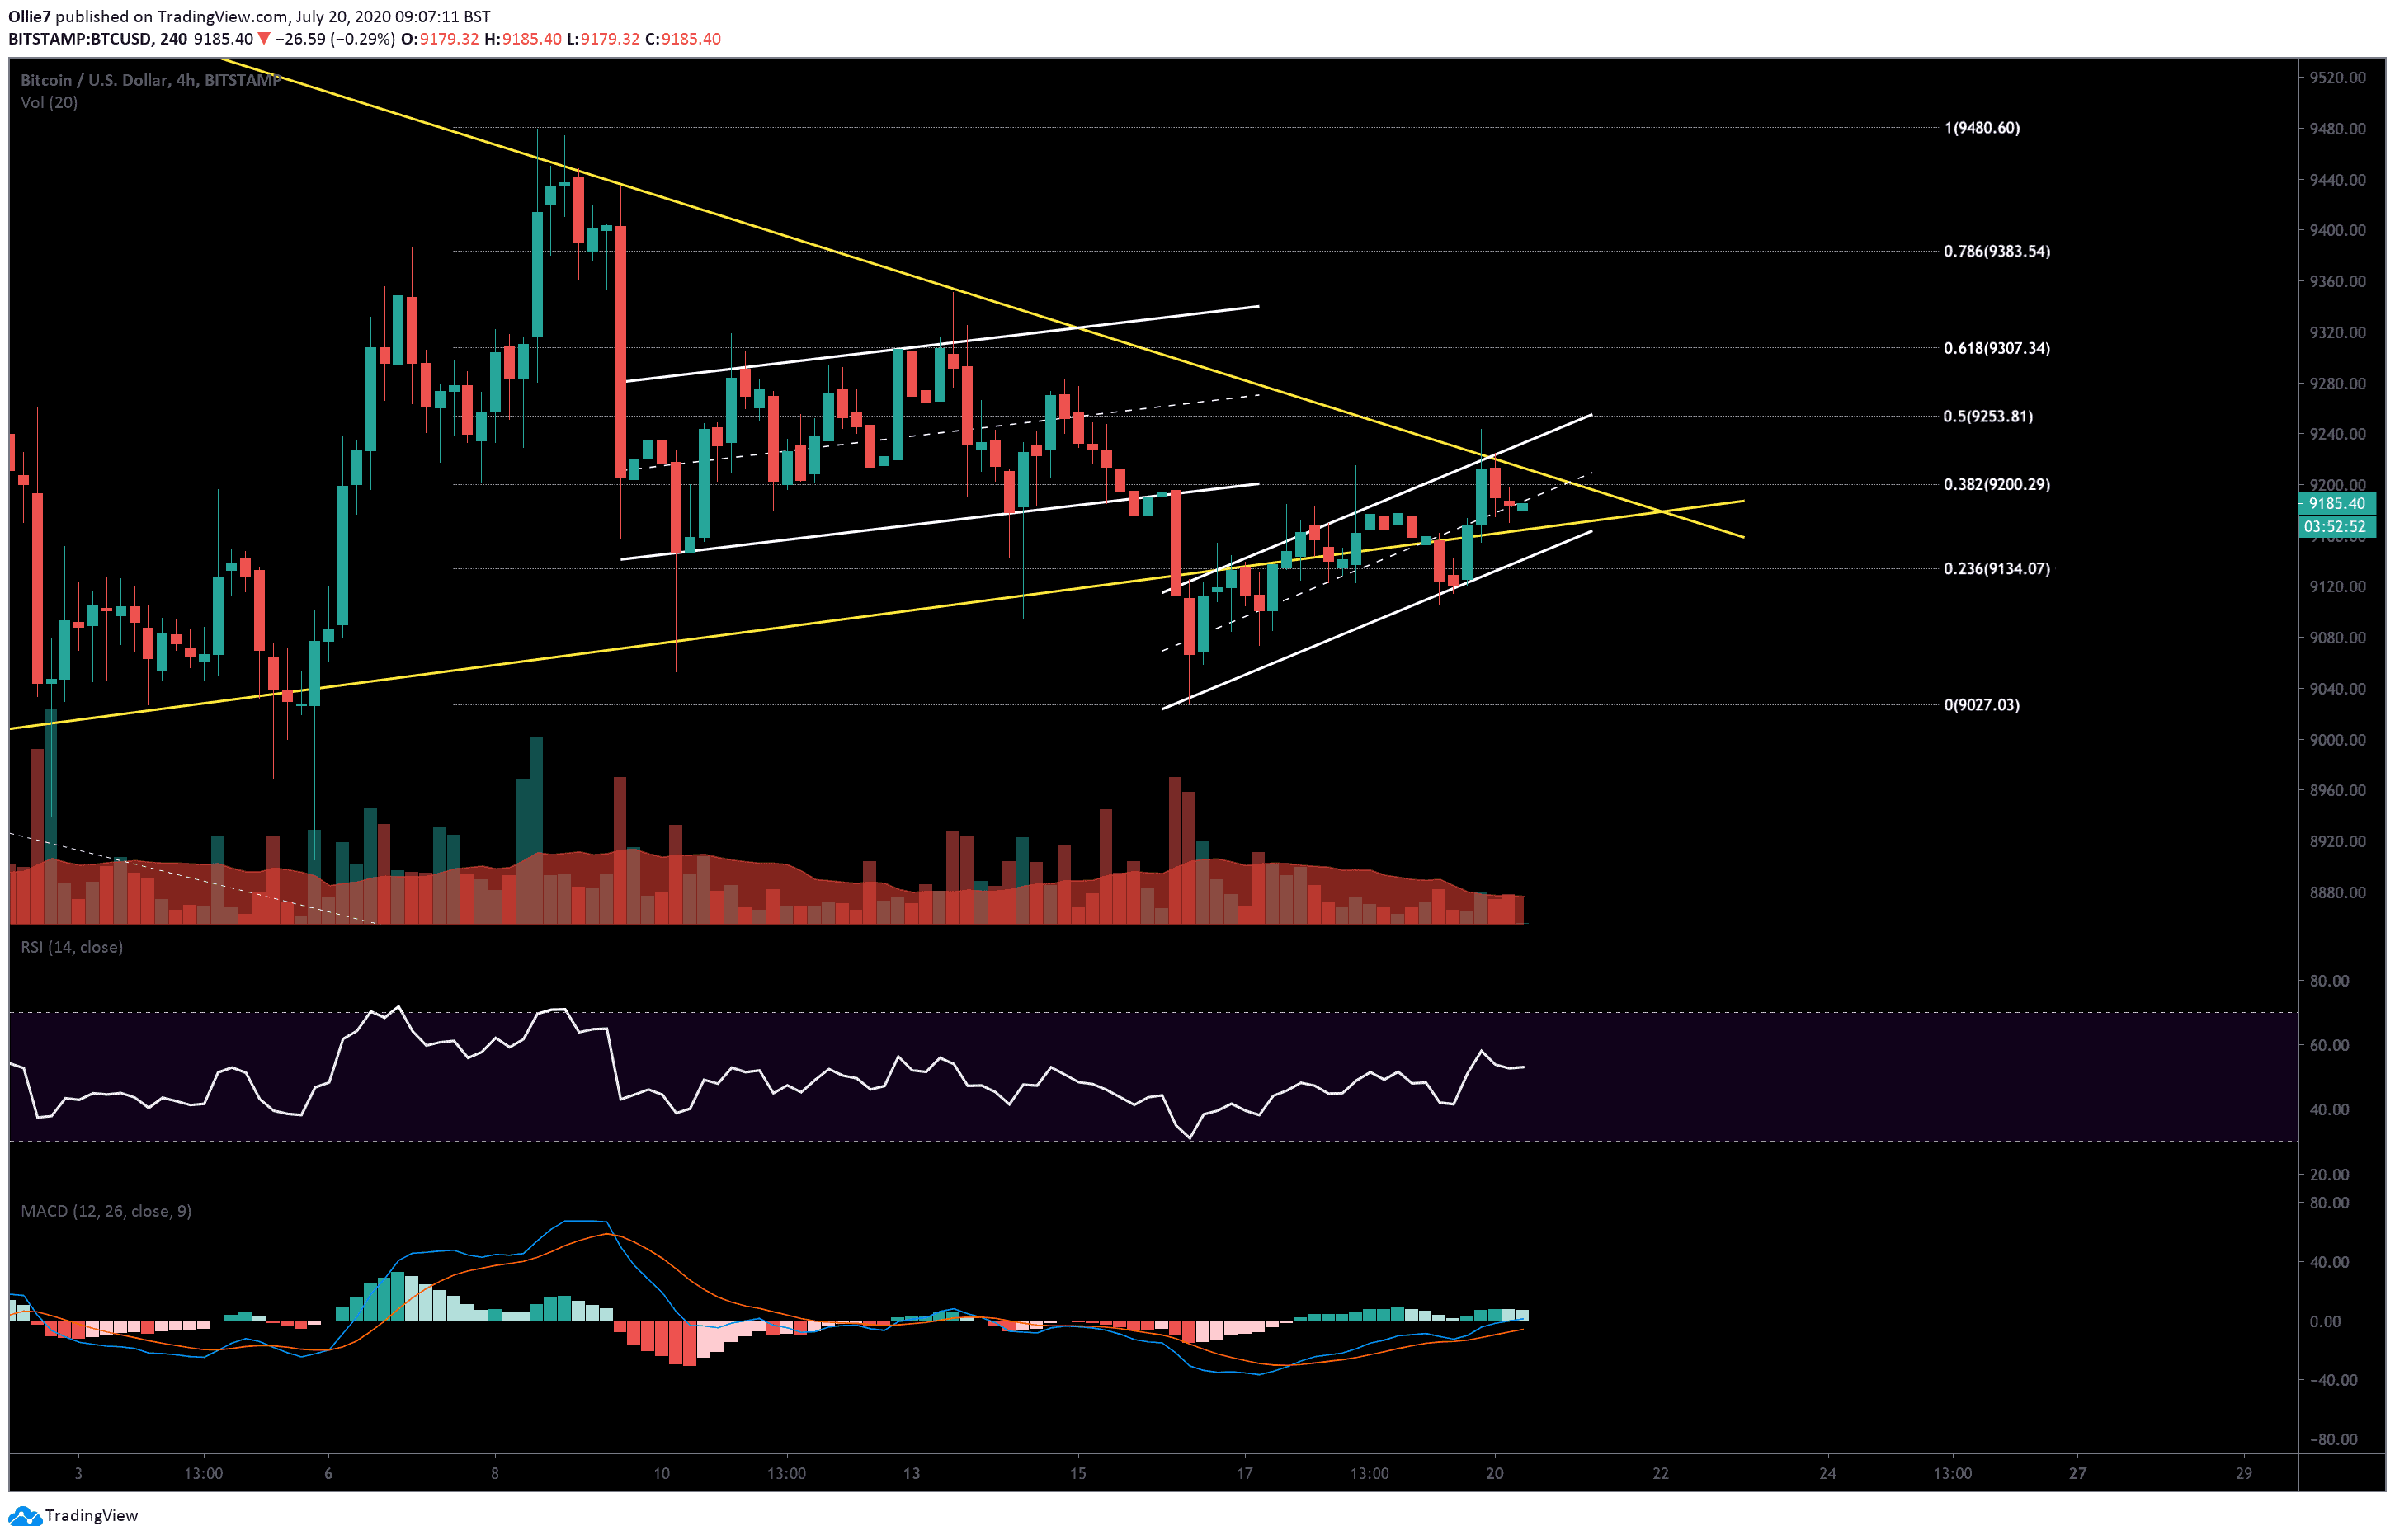
On the 4-Hour BTC/USD chart, we can see that the current price action is tracking inside a second bear flag pattern (lower white channel). This will be putting a lot of pressure on bullish traders to keep prices above $9,100, which has been critical short-term support during the last several days.
On the daily chart, we can see that the latest uptrend has been inhibited by strong resistance at the 0.236 Fibonacci level (highlighted red line) at $9,211. Bitcoin’s price will need to break above this key level soon to reassure traders, otherwise, a panic-driven crash could begin.
The low volatility is making it difficult to predict the direction of Bitcoin’s next move. The last time volatility levels were so low was back in November 2018, when the price plunged to $3,120.
Both the RSI and MACD indicators are now flat and trading volume remains consistent, albeit low. The only promising signal of a possible bullish breakout is the fact that the overall crypto market capital has been steadily rising over the last 4 days, from $267 billion to its current value at $272 billion.
Money entering the market is always a good sign.
Price Levels to Watch in the Short-term
A convincing close above the $9,200 on the 4-Hour would be a good start for bitcoin bulls. Breaking this key Fibonacci resistance could signal to other traders that the long consolidation is about to break out to the upside, and trigger a fresh wave of buying pressure.
It would also push BTC/USD prices above the main down-trending resistance on the daily chart, which has managed to quash 6 breakout attempts since June 1. This could also whip buyers into a frenzy.
From there, the $9,270 and $9,300 levels could create some short-term resistance during the breakout.
Looking South, we should expect the up-trending support (yellow line on daily) to create some early support. This sits approximately at $9,166. After that, we have the lower support of the second bear flag, which currently resides around the $9,140 mark. If that fails, we will watch the $9,000 for a reaction.
Total Market Capital: $278 billion
Bitcoin Market Capital: $169 billion
Bitcoin Dominance Index: 60.8%
* Data by Coingecko.
BTC/USD Bitstamp Daily Chart
BTC/USD Bitstamp 4-Hour Chart
The post Bitcoin Price Analysis: BTC to $8K Or $10K? That’s the Question Following Zero Volatility appeared first on CryptoPotato.