Bitcoin Price Analysis: BTC Still In Danger As Bulls Struggle To Reclaim The $50K Mark
Bitcoin is down by a total of 17% since last Sunday as the primary cryptocurrency struggles to regain ground above the $50,000 milestone. Most of the downside action took place on Wednesday, after Tesla announced they halted to accept BTC as a payment method for their electric vehicles.
The news sent BTC tumbling as it slipped to an 11-week low at $45,700, according to Bitstamp. The bulls attempted to rebound on Thursday and Friday as they battled to break back above $50,000. Although they did spike above the level, they failed to close a daily candle above $50,000.
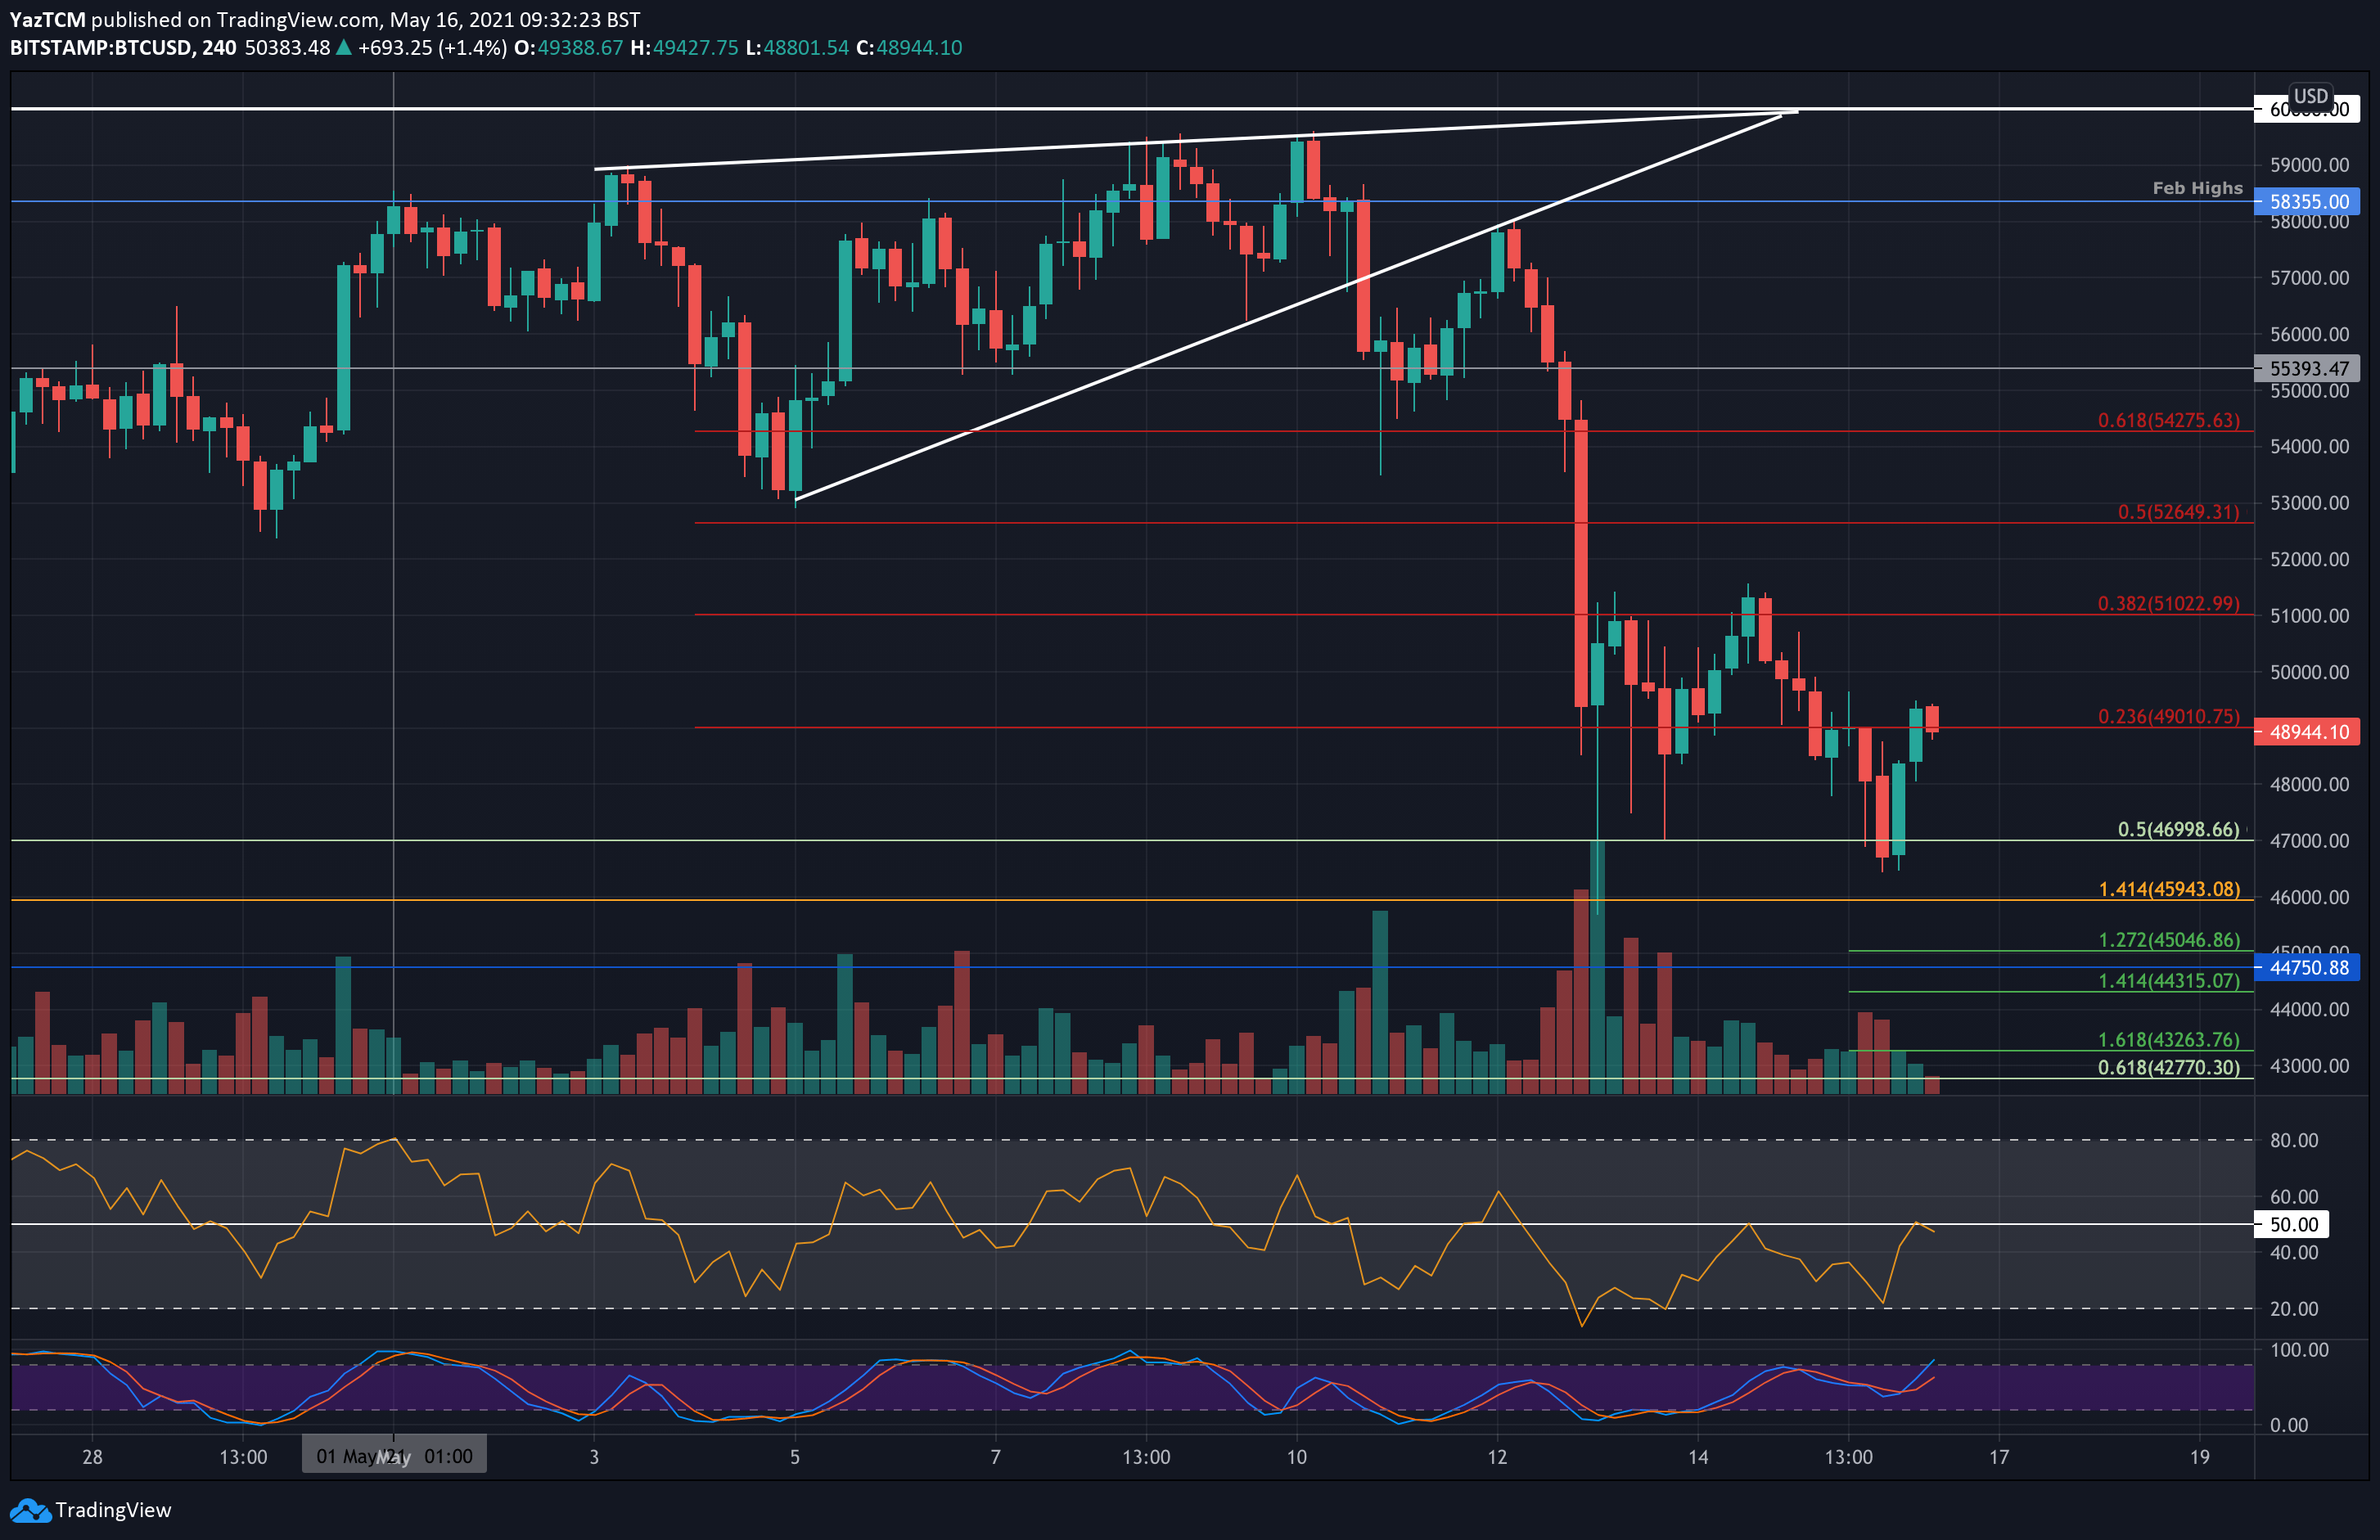
Earlier today, the bulls have started to rebound but are seeing resistance around $49,000, where lies a bearish .236 Fib Retracement.
Yesterday’s price drop caused bitcoin to fall and close beneath a long-term rising trend line dating back to February 2021. However, the market is still battling to remain above the neckline of the following long-term Head & Shoulders pattern. So far, so good; however, the bearish H&S pattern is still valid.
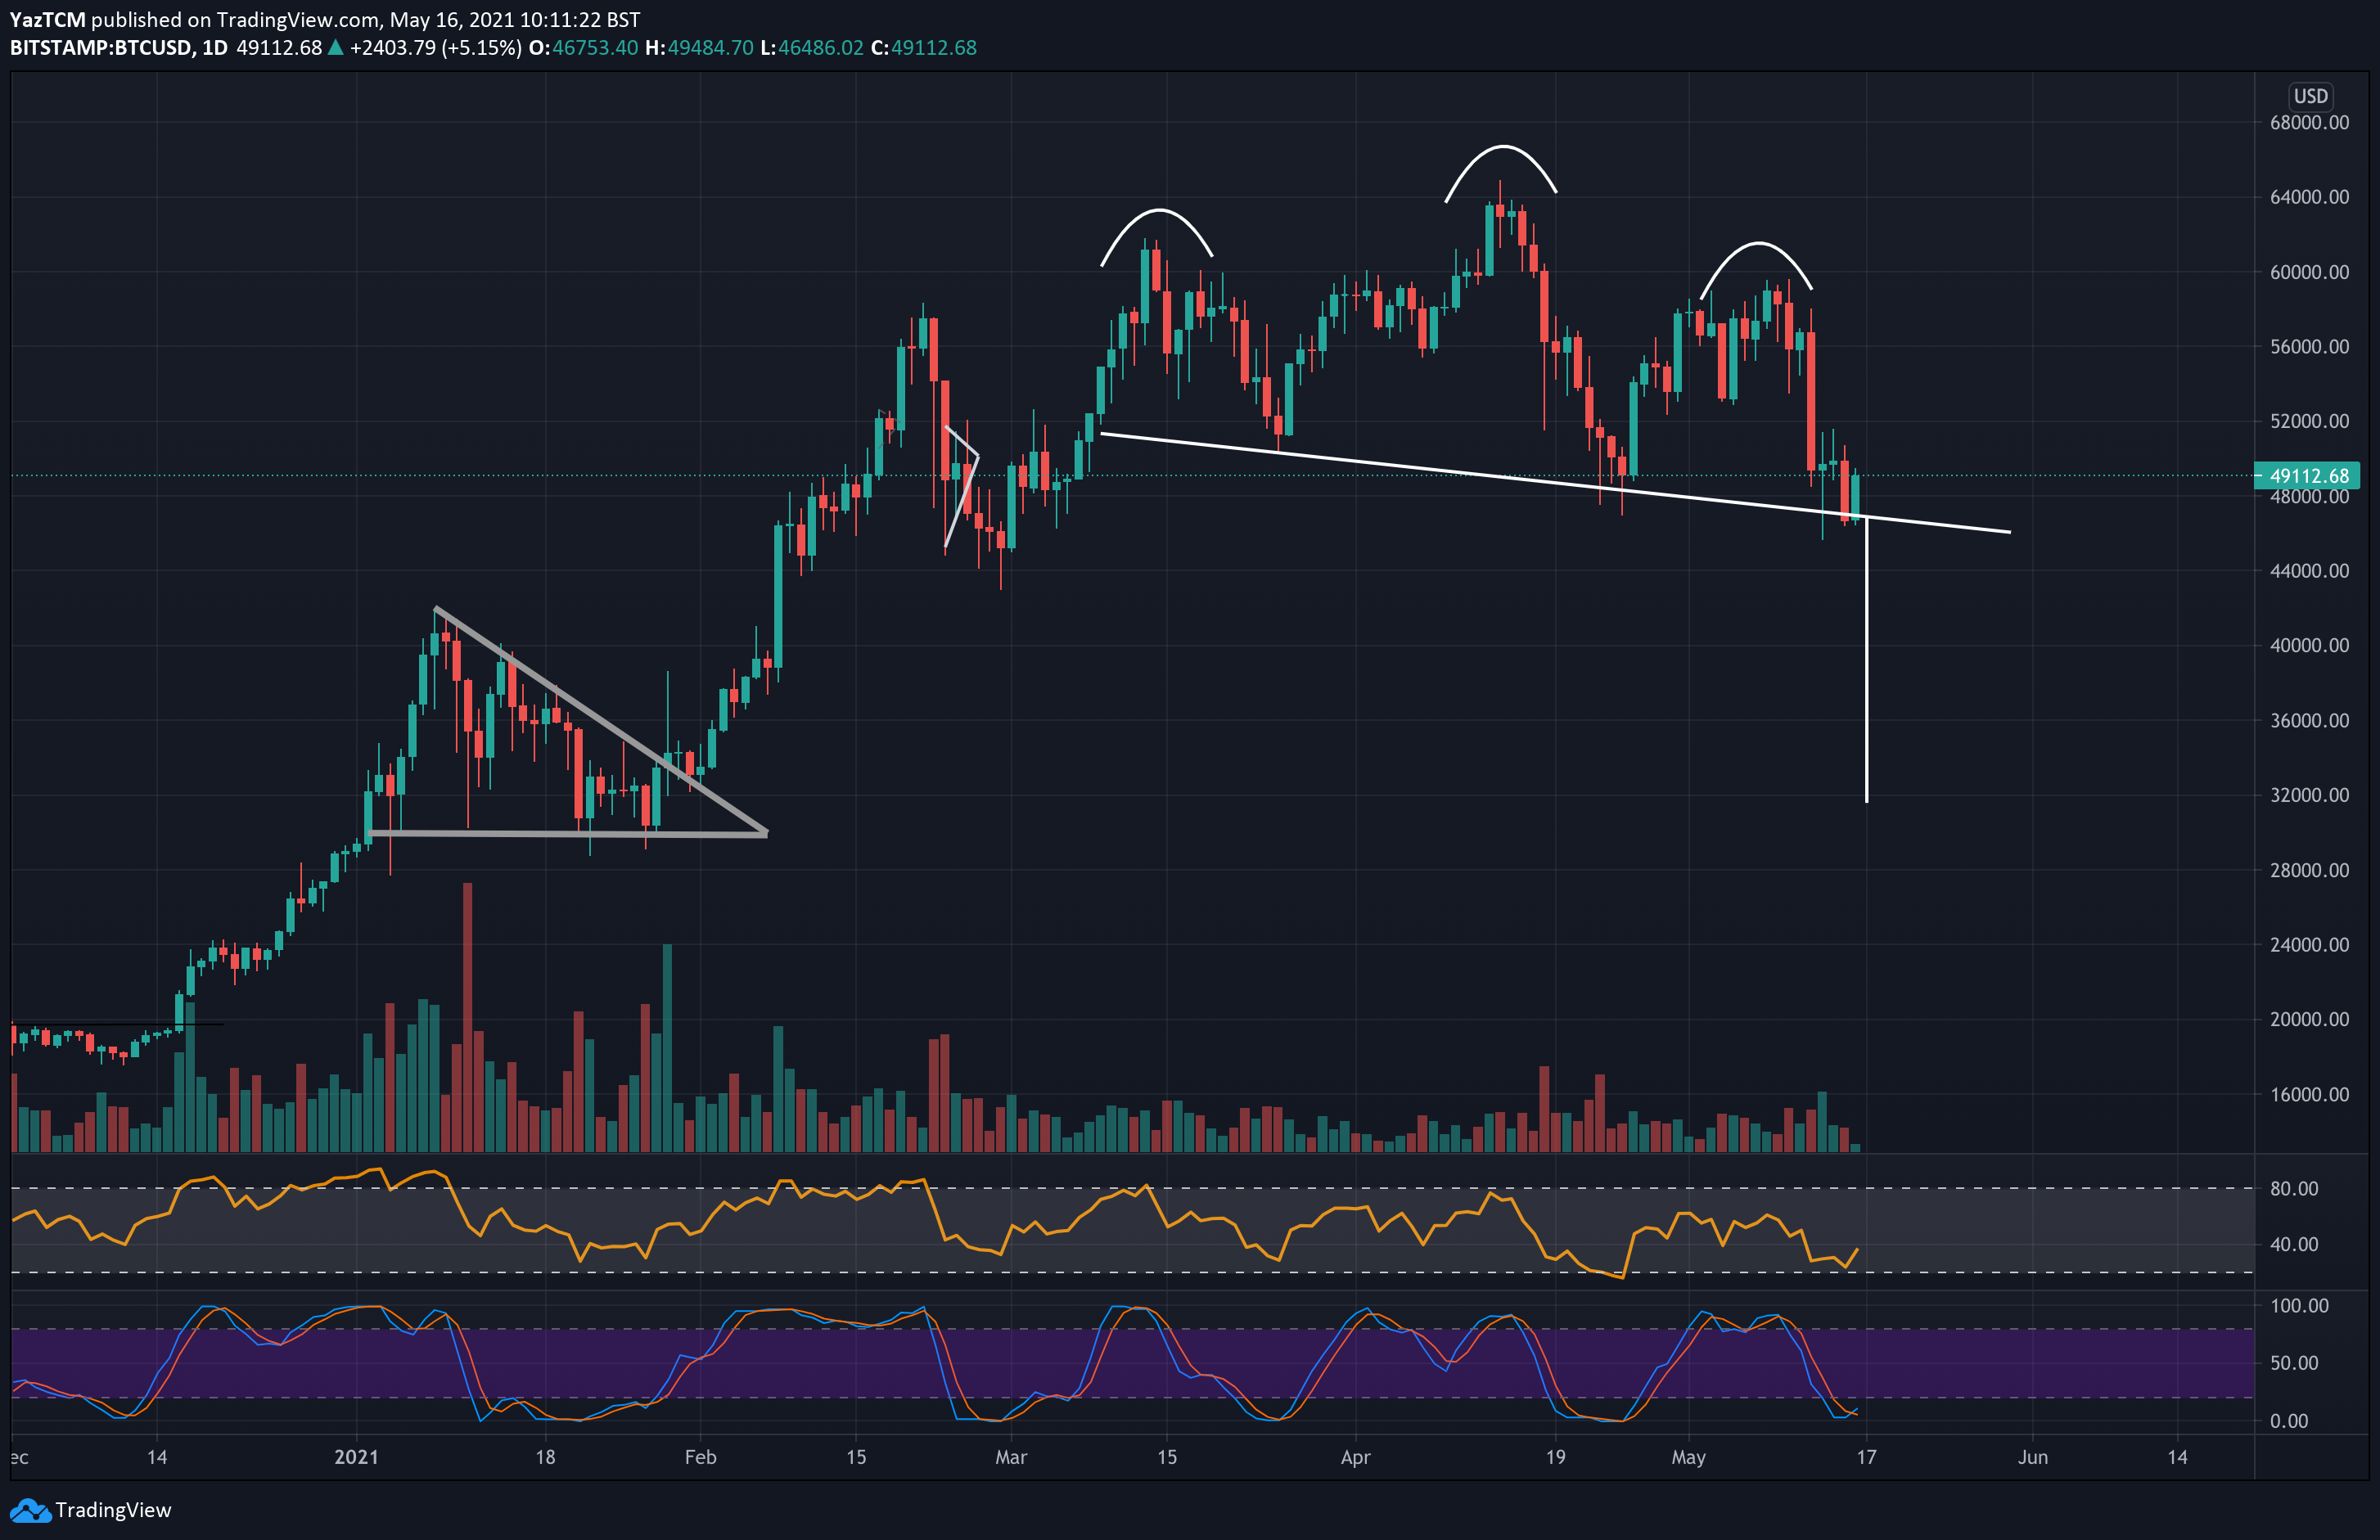
A break beneath this neckline, with a daily close below, could result in Bitcoin plummetting into the $32,000 level. Lastly, it is essential to point out the price drop this week caused bitcoin to make a lower low – a worrying signal that could be the first alert of the current bull run potentially ending.
BTC Price Support and Resistance Levels to Watch
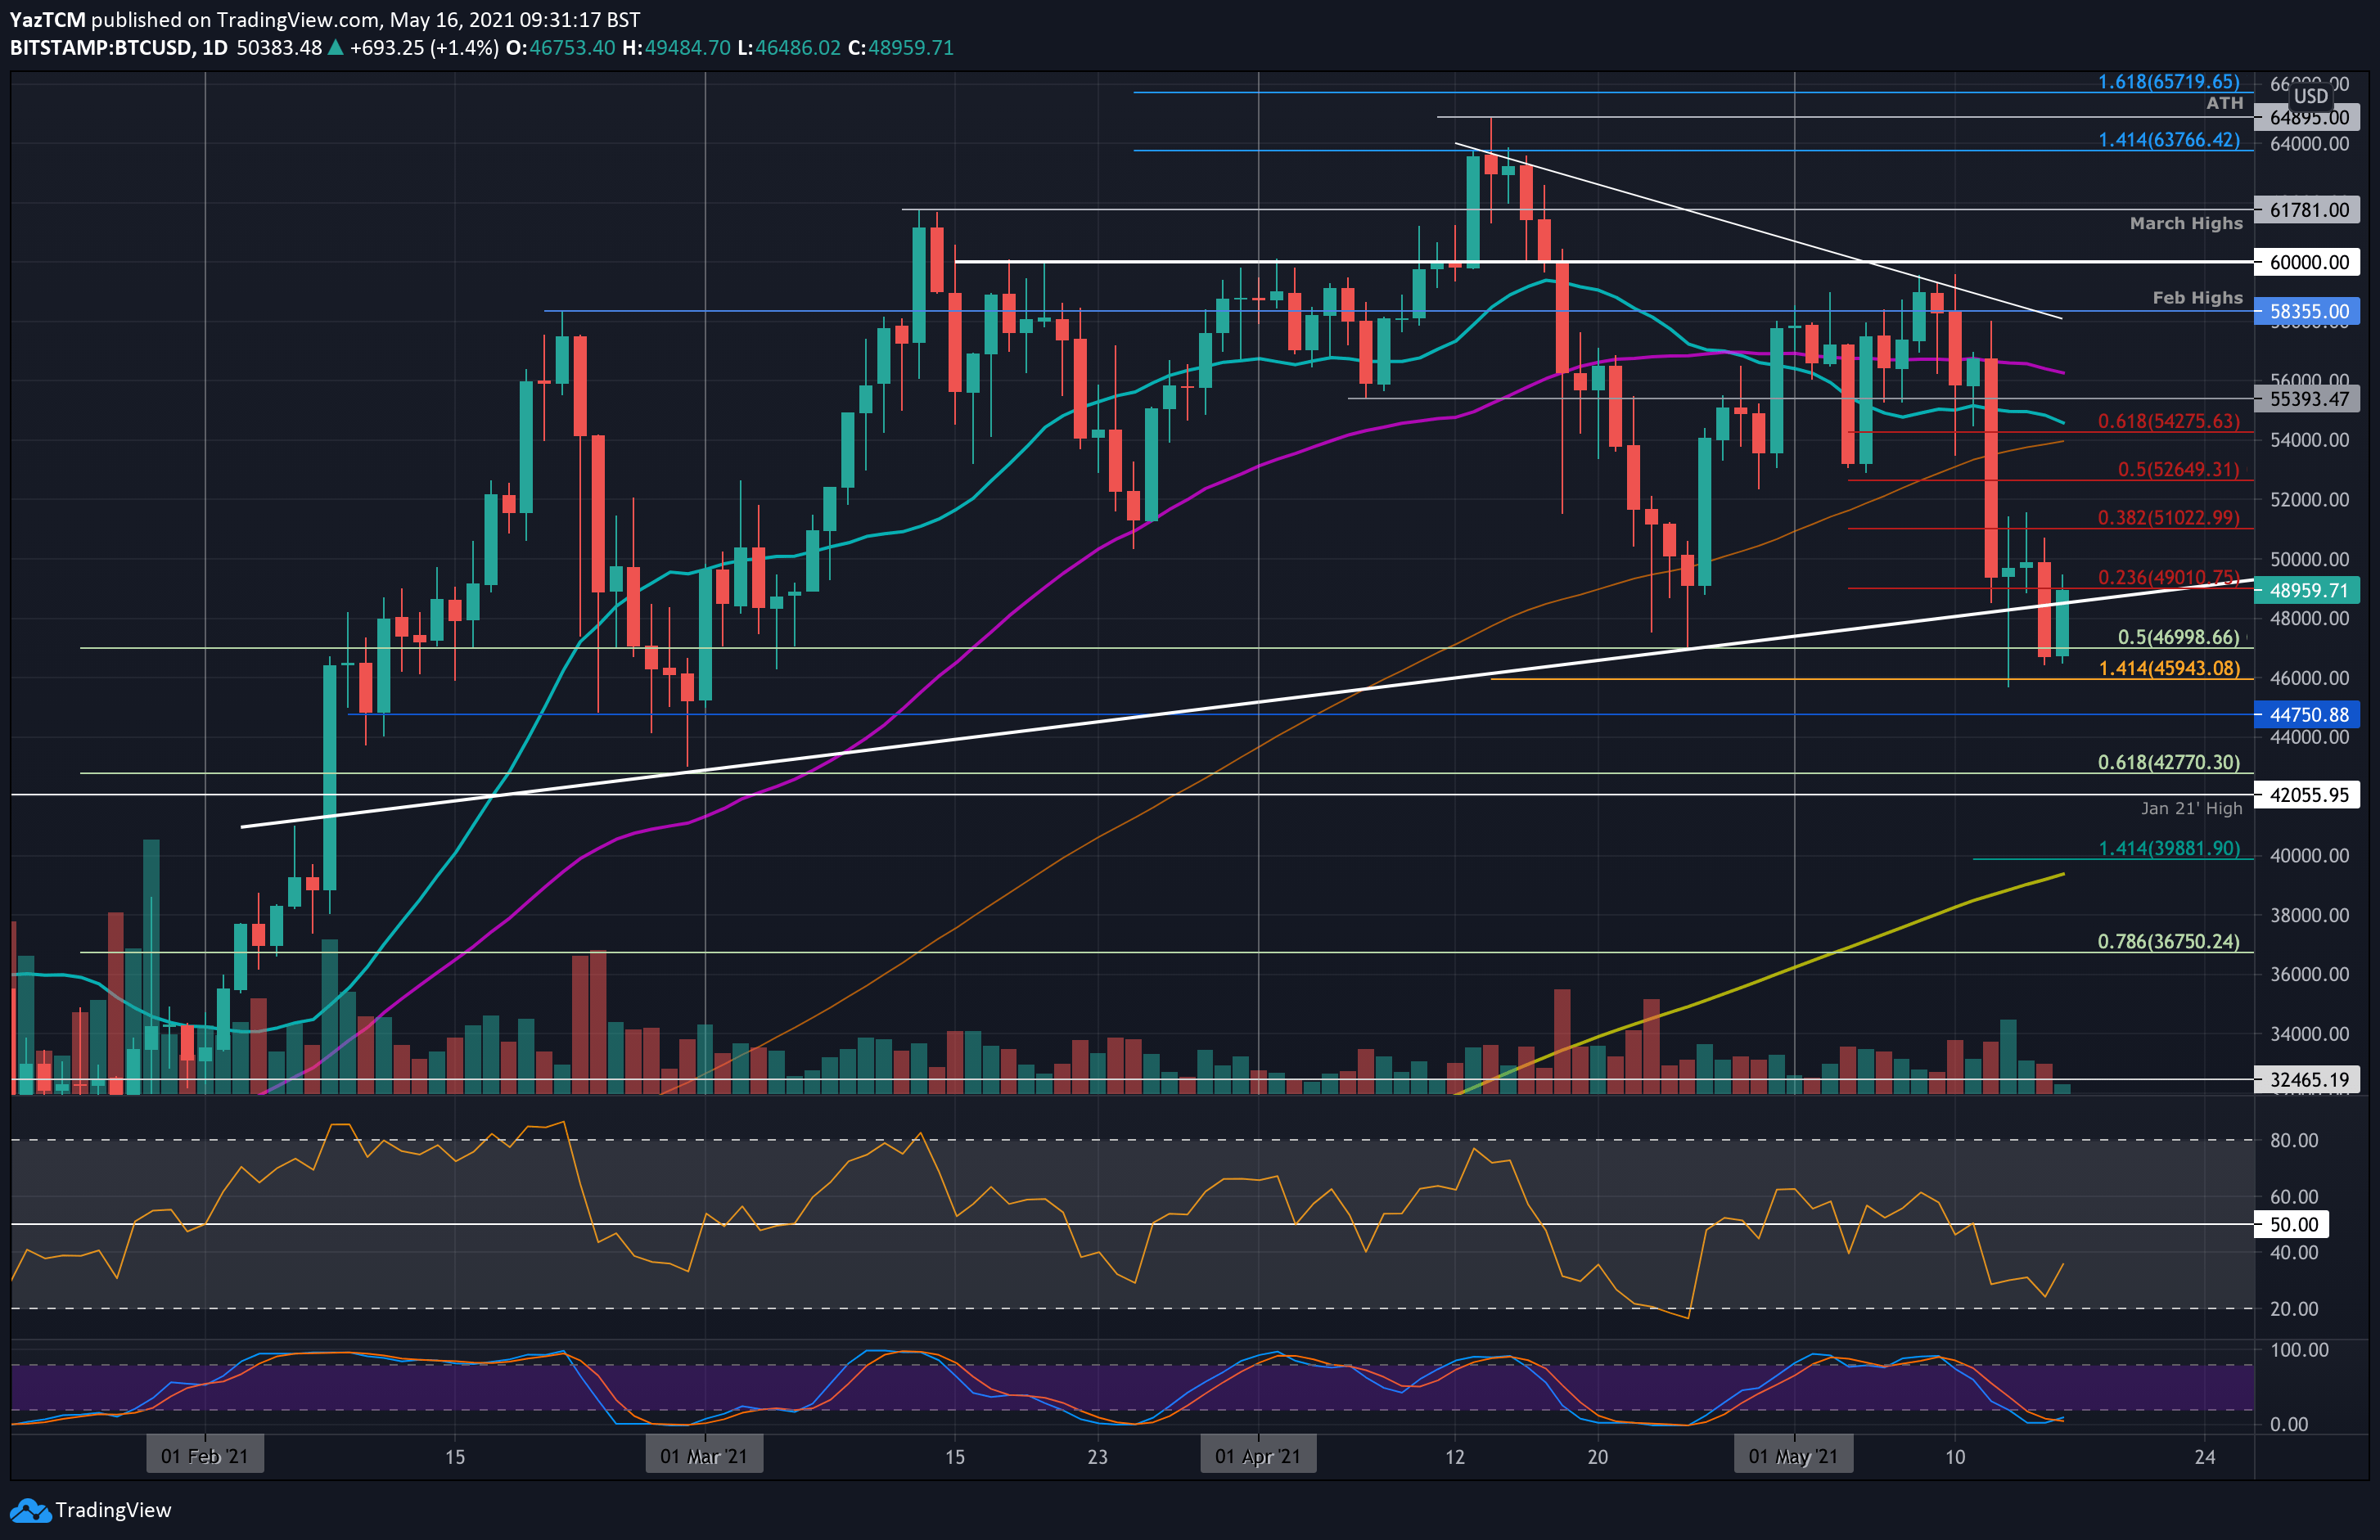
Key Support Levels: $49,000, $46,500, $46,000, $44,750, $42,770, $42,000.
Key Resistance Levels: $50,000, $51,000, $52,650.
Looking ahead, the first support lies at current levels around the $49k mark. This is followed by today’s low – around $46,500 and $46,000 (Downside 1.414 Fib Extension). Further below lies $44,750, $42,770 (.618 Fib), and $42,000 (Jan 21 highs).
On the other side, the first strong resistance lies at $49,000 (bearish .236 Fib). This is followed by $50,000, $51,000 (bearish .382 Fib), $52,650 (bearish .5 Fib), and $54,000 (100-days MA).
The RSI has bounced from near oversold conditions, which could suggest the recently short-term bearish momentum is starting to fade. Additionally, the Stochastic RSI is primed for a bullish crossover signal that could bring bullish pressure back into the market.
Bitstamp BTC/USD Daily Chart
Bitstamp BTC/USD 4-Hour Chart