Bitcoin Price Analysis: BTC Skyrockets $800 To New 5-Month High, Now Facing Critical Resistance From 2019
This is going to be a quick update following our latest Bitcoin price analysis from yesterday.
As mentioned yesterday, since the year of 2020 begun, Bitcoin price had gone through three mini-rallies. All those rallies corrected back to the Fibonacci retracement level of 38.2% (a clear sign of bullish uptrend).
The last of the three rallies ended yesterday, while Bitcoin corrected to $9,750 (which is the 38.2% Fib level).
We stated in our analysis that in the case Bitcoin maintains that level – the higher-highs trajectory is kept alive and more than that, this way of rising is a lot healthier than the rapid parabolic way.
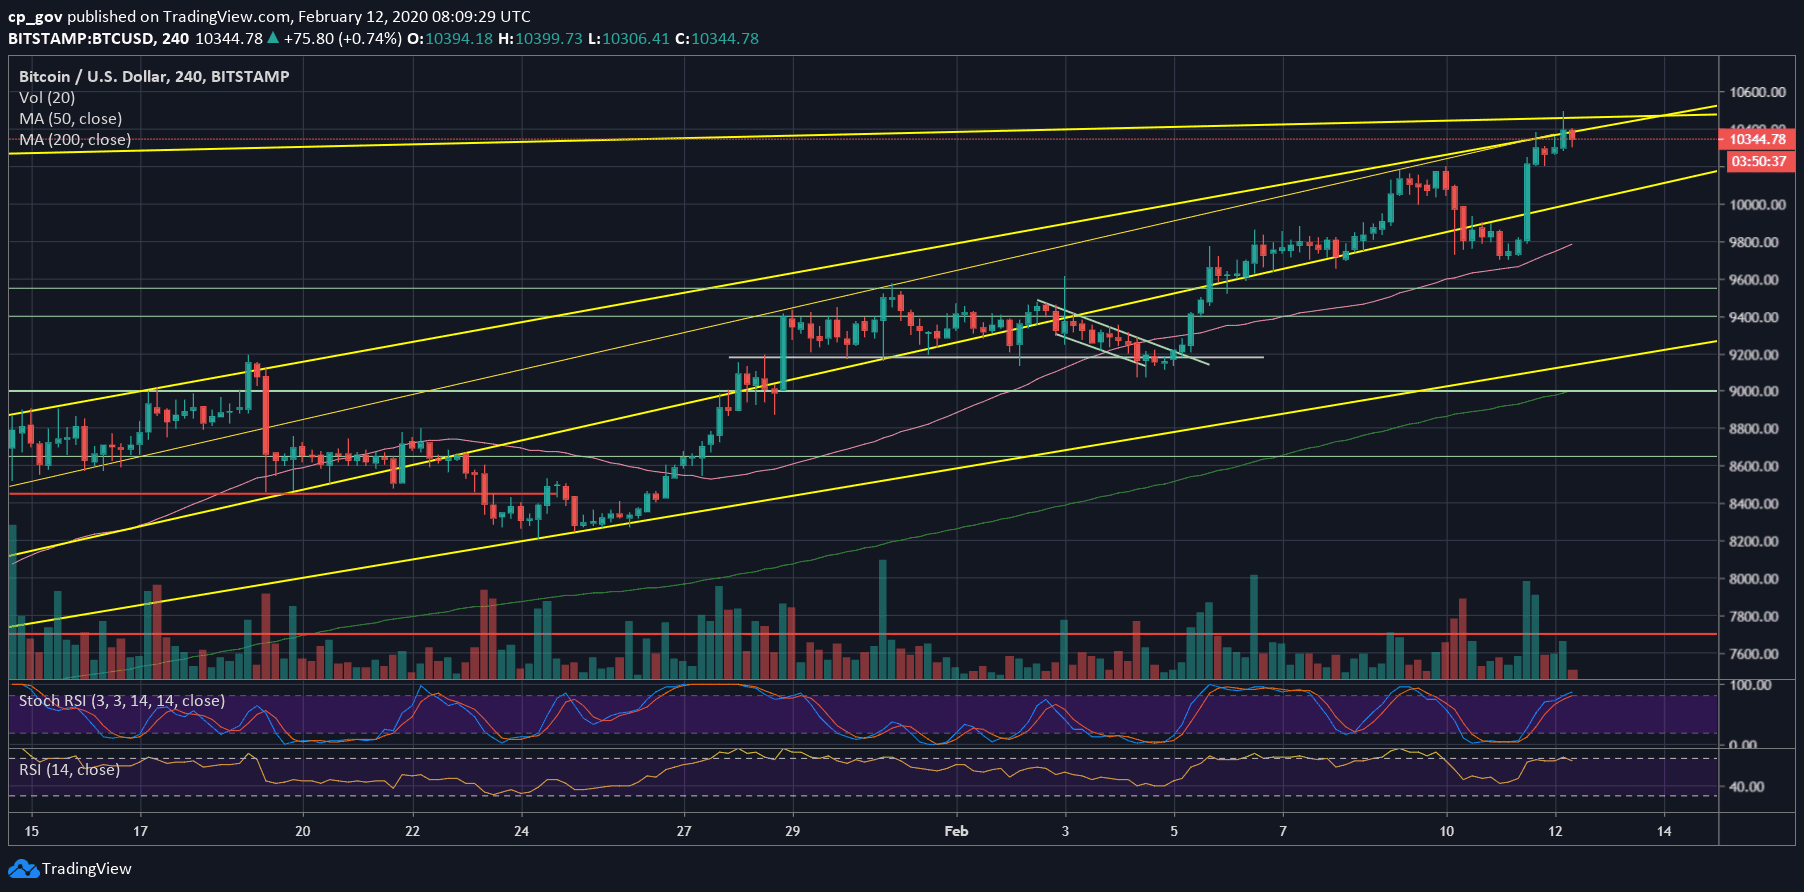
Long story short, Bitcoin maintained the 38.2% Fib level once again, followed by a huge price rally to $10,400, then retracement back to the prior resistance turned support level at $10,200. Following a few hours of consolidation, we currently witness Bitcoin breaking to a new 2020 high and surpassing the prior $10,350 high that was reached during the October 26 “Chinese Pump.”
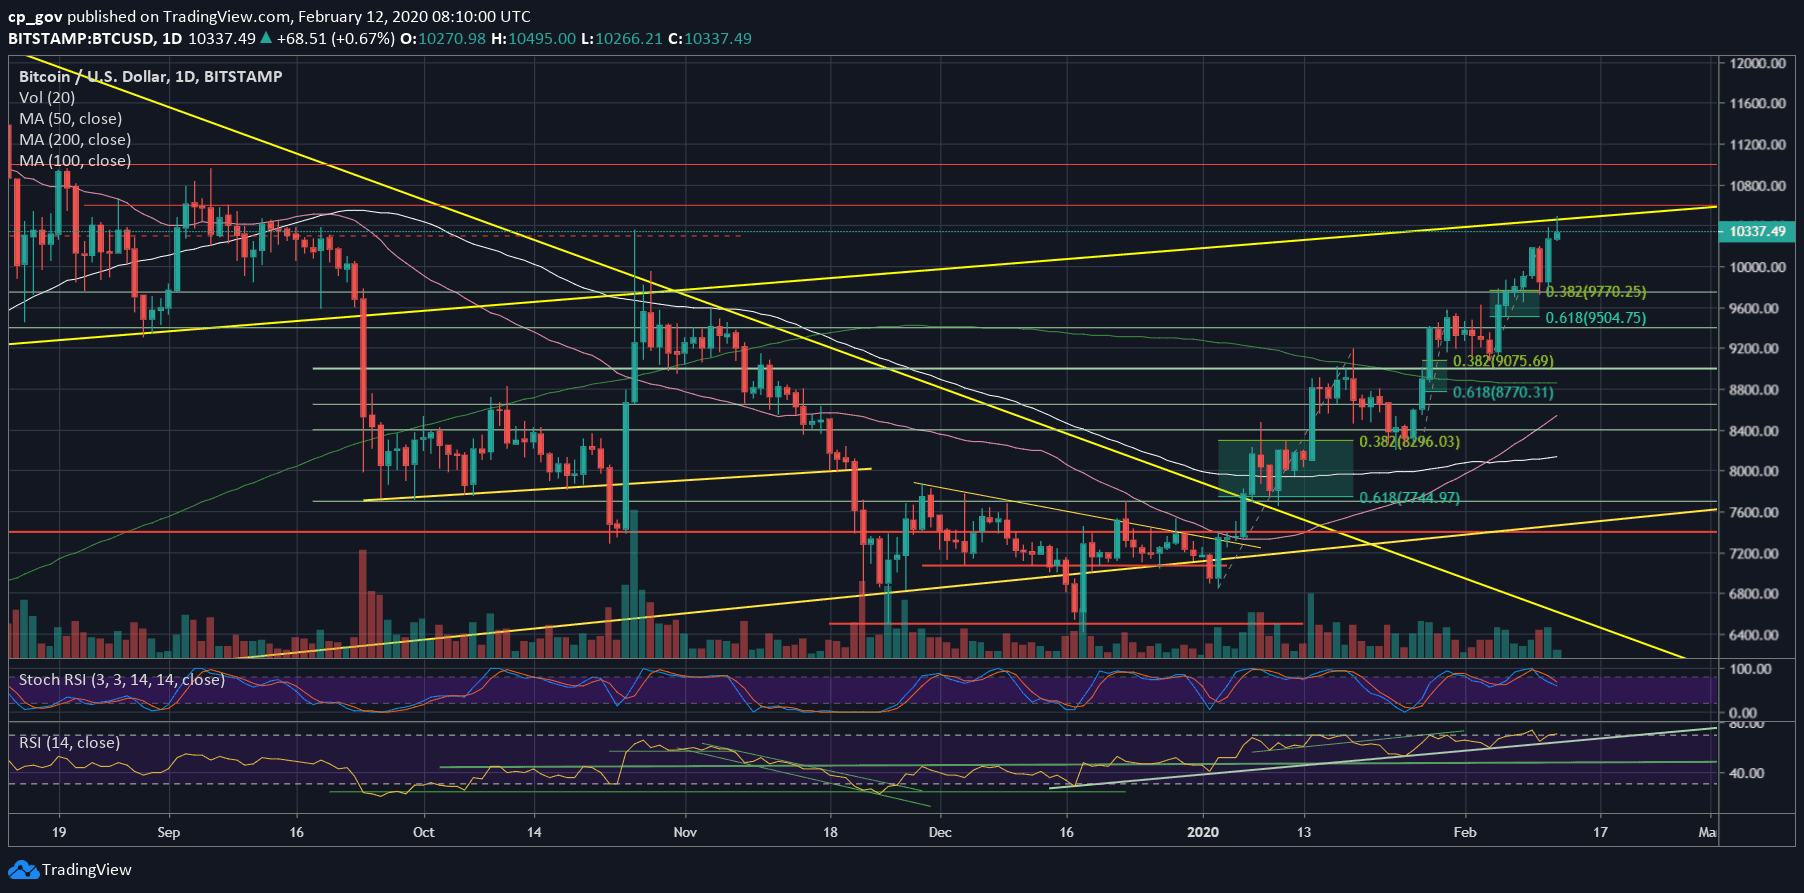
As of writing these lines, Bitcoin marks $10,500 as its new 2020 high, which is also the highest level since September 2019. However, as can be seen on the following daily chart, this is precisely where a significant long-term ascending trend-line lies.
Total Market Cap: $302 billion
Bitcoin Market Cap: $189 billion
BTC Dominance Index: 62.6%
*Data by CoinGecko
Key Levels To Watch & Next Possible Targets
– Support/Resistance levels: Bitcoin is currently trading inside the confluence price zone of $10,300 – $10,400. This, together with close by resistance at $10,500 (the current 2020 high) could slow Bitcoin down a bit.
In case of a correction, the first level of support would be the current price level, followed by $10,200. Further below lies the $10,000 benchmark. Further below lies $9700 – $9800, which is the low from yesterday.
In case Bitcoin breaks $10,500, we can expect the rally to get out of control quickly. The next resistance would be $10,600, followed by $11,000 and $11,200.
– The RSI Indicator: After finding support on the mid-term ascending RSI trend-line, the significant momentum indicator is showing a little bit of bearish price divergence on the daily. This might signal on a correction coming up, but not necessarily. We will keep our eyes on the indicator
– Trading volume: The bulls are strong here as well. Yesterday reversal volume surpassed Monday’s volume candle. Euphoria in the markets.
BTC/USD BitStamp 4-Hour Chart
BTC/USD BitStamp 1-Day Chart
The post Bitcoin Price Analysis: BTC Skyrockets $800 To New 5-Month High, Now Facing Critical Resistance From 2019 appeared first on CryptoPotato.