Bitcoin Price Analysis: BTC Sets ATH at $53K, is $60,000 in Sight?
Bitcoin is up by 2.2% today as the coin increased by $2,300 from today’s low of $50,627 to set a new ATH price at $52,943.
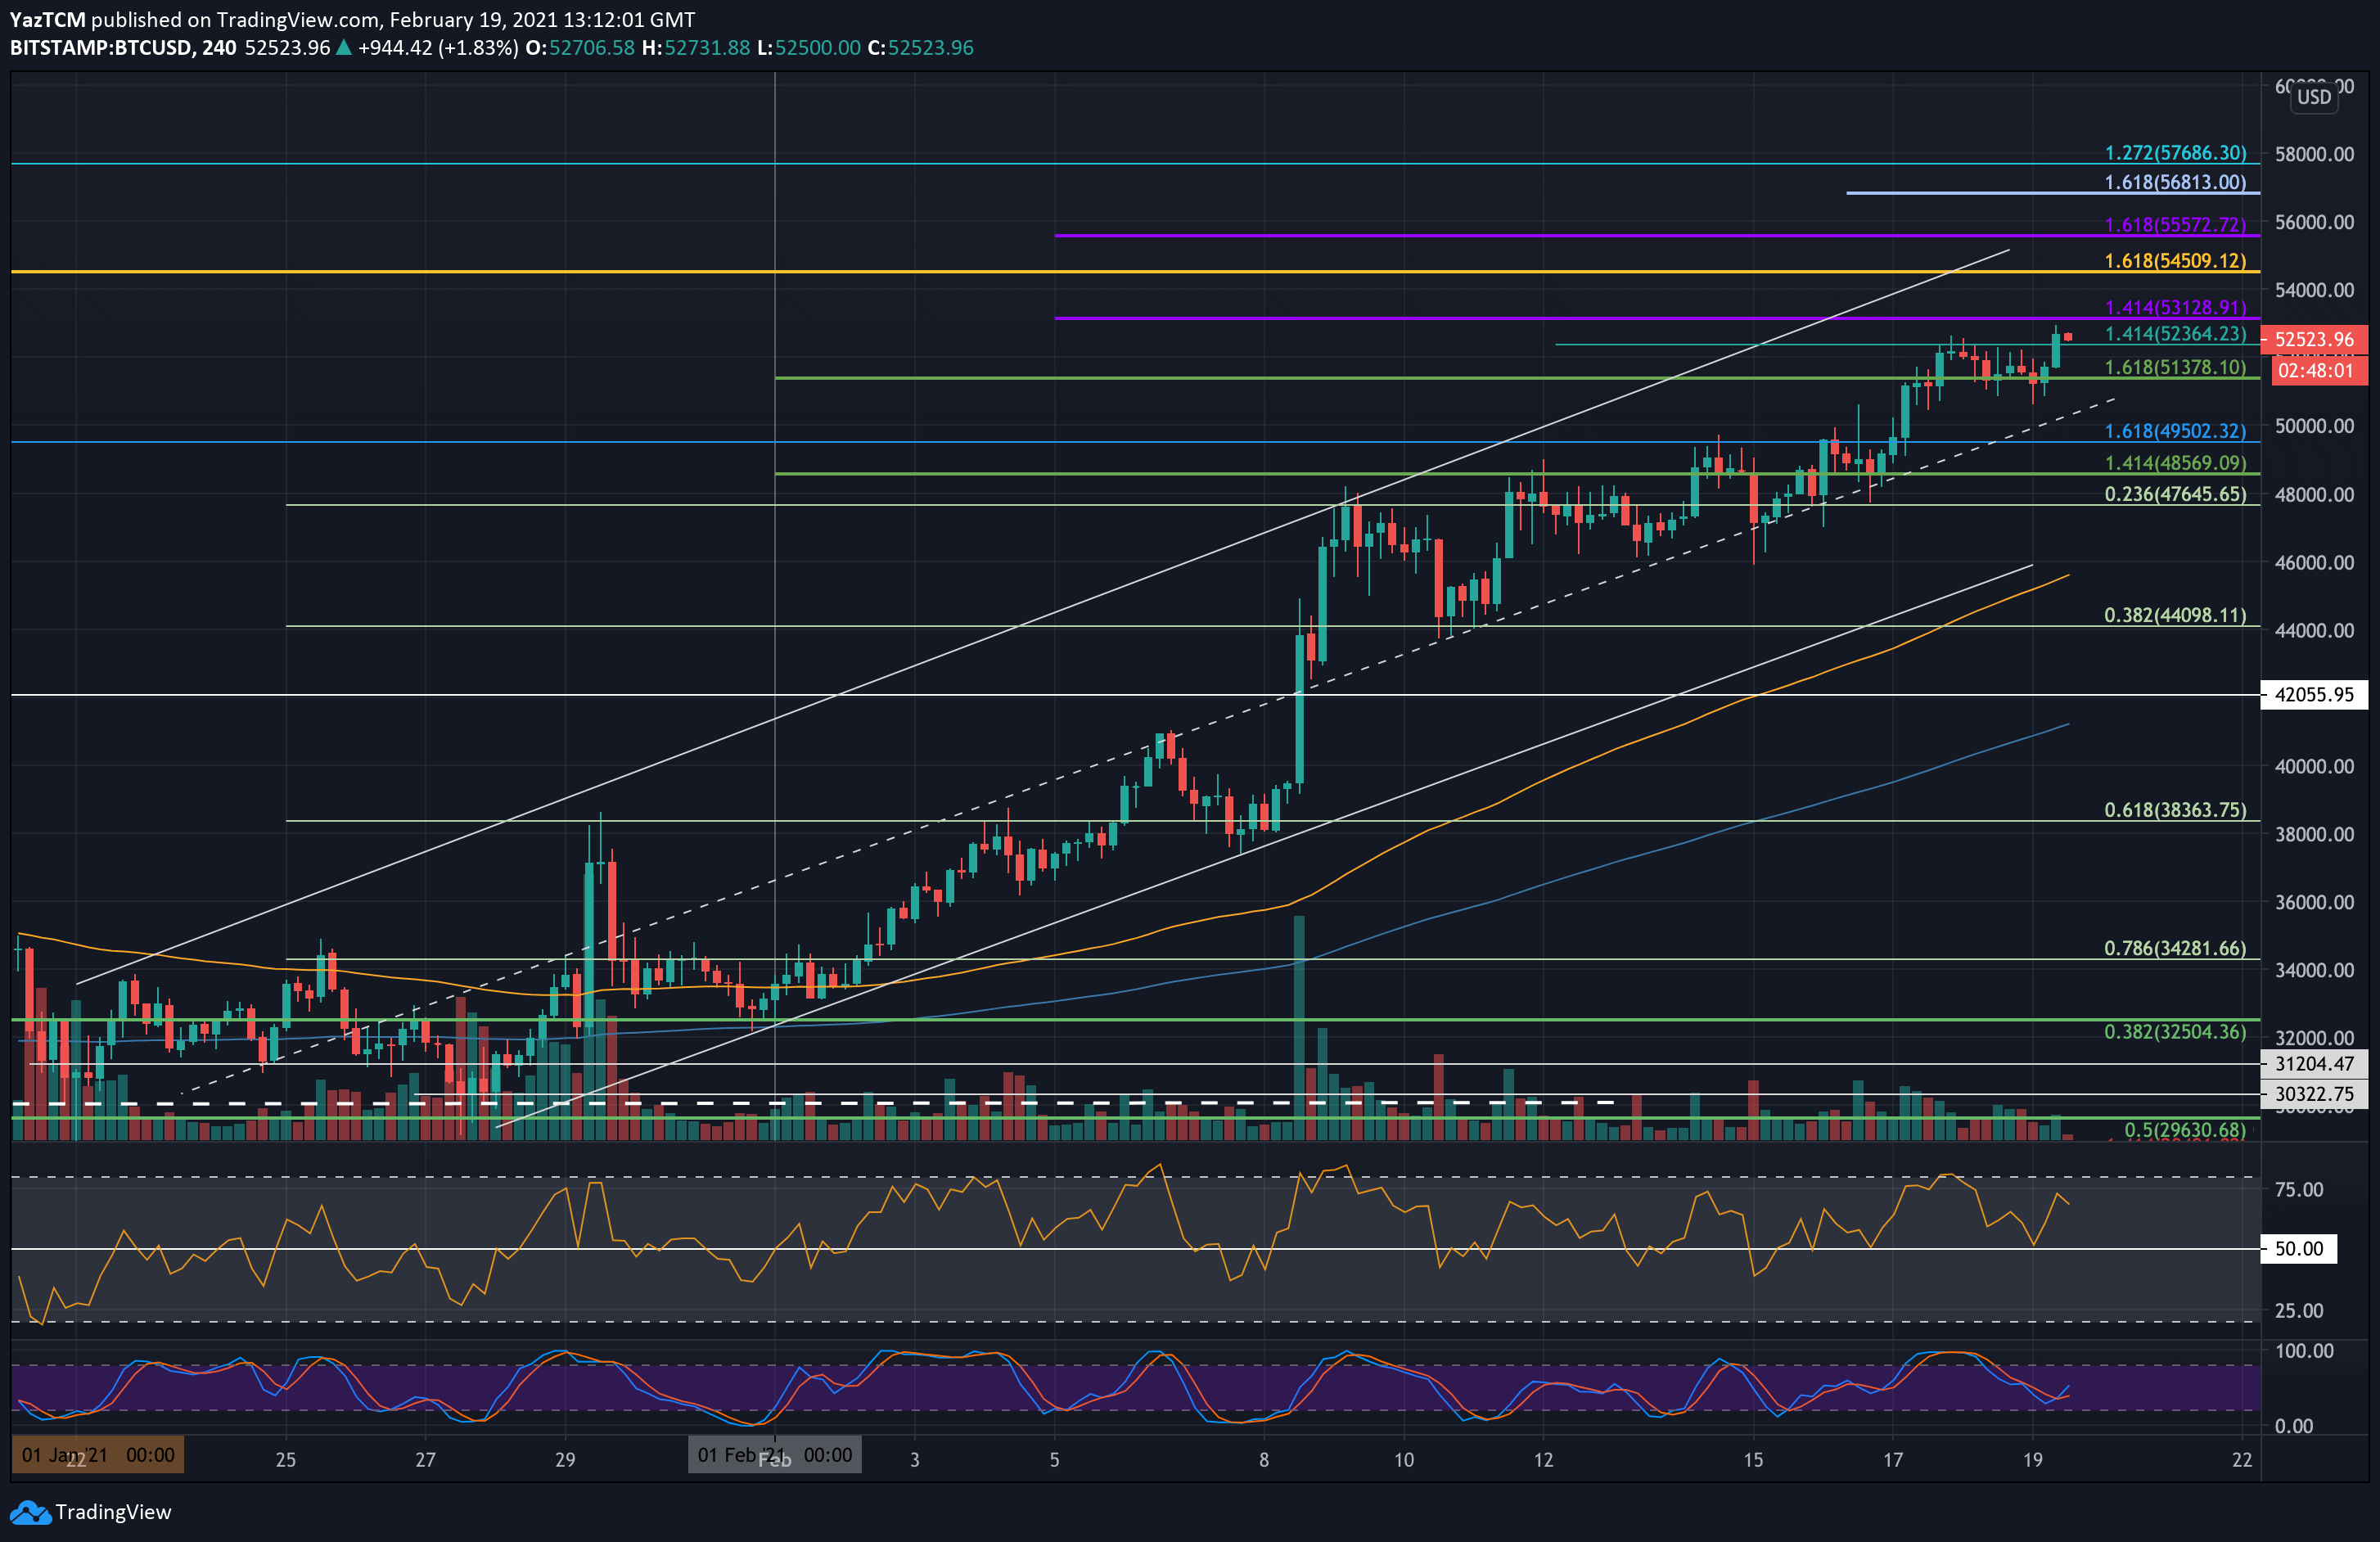
Overall, the cryptocurrency has managed to surge by 10% over the past week after breaching the $50,000 level on Wednesday to reach the resistance level at $52,365 (short-term 1.414 Fib extension). BTC has been battling with this resistance over the past 48 hours as it has been unable to close a daily candle above it so far. It will be interesting to see if Bitcoin can make it in today’s daily candle.
Looking at the larger picture, the cryptocurrency is trading within an ascending price channel since the beginning of February and over the past two weeks, while finding support upon the midline (equilibrium).
Since February 8th, when Bitcoin broke above the previous ATH at $42K, all daily candle closes were above the support.
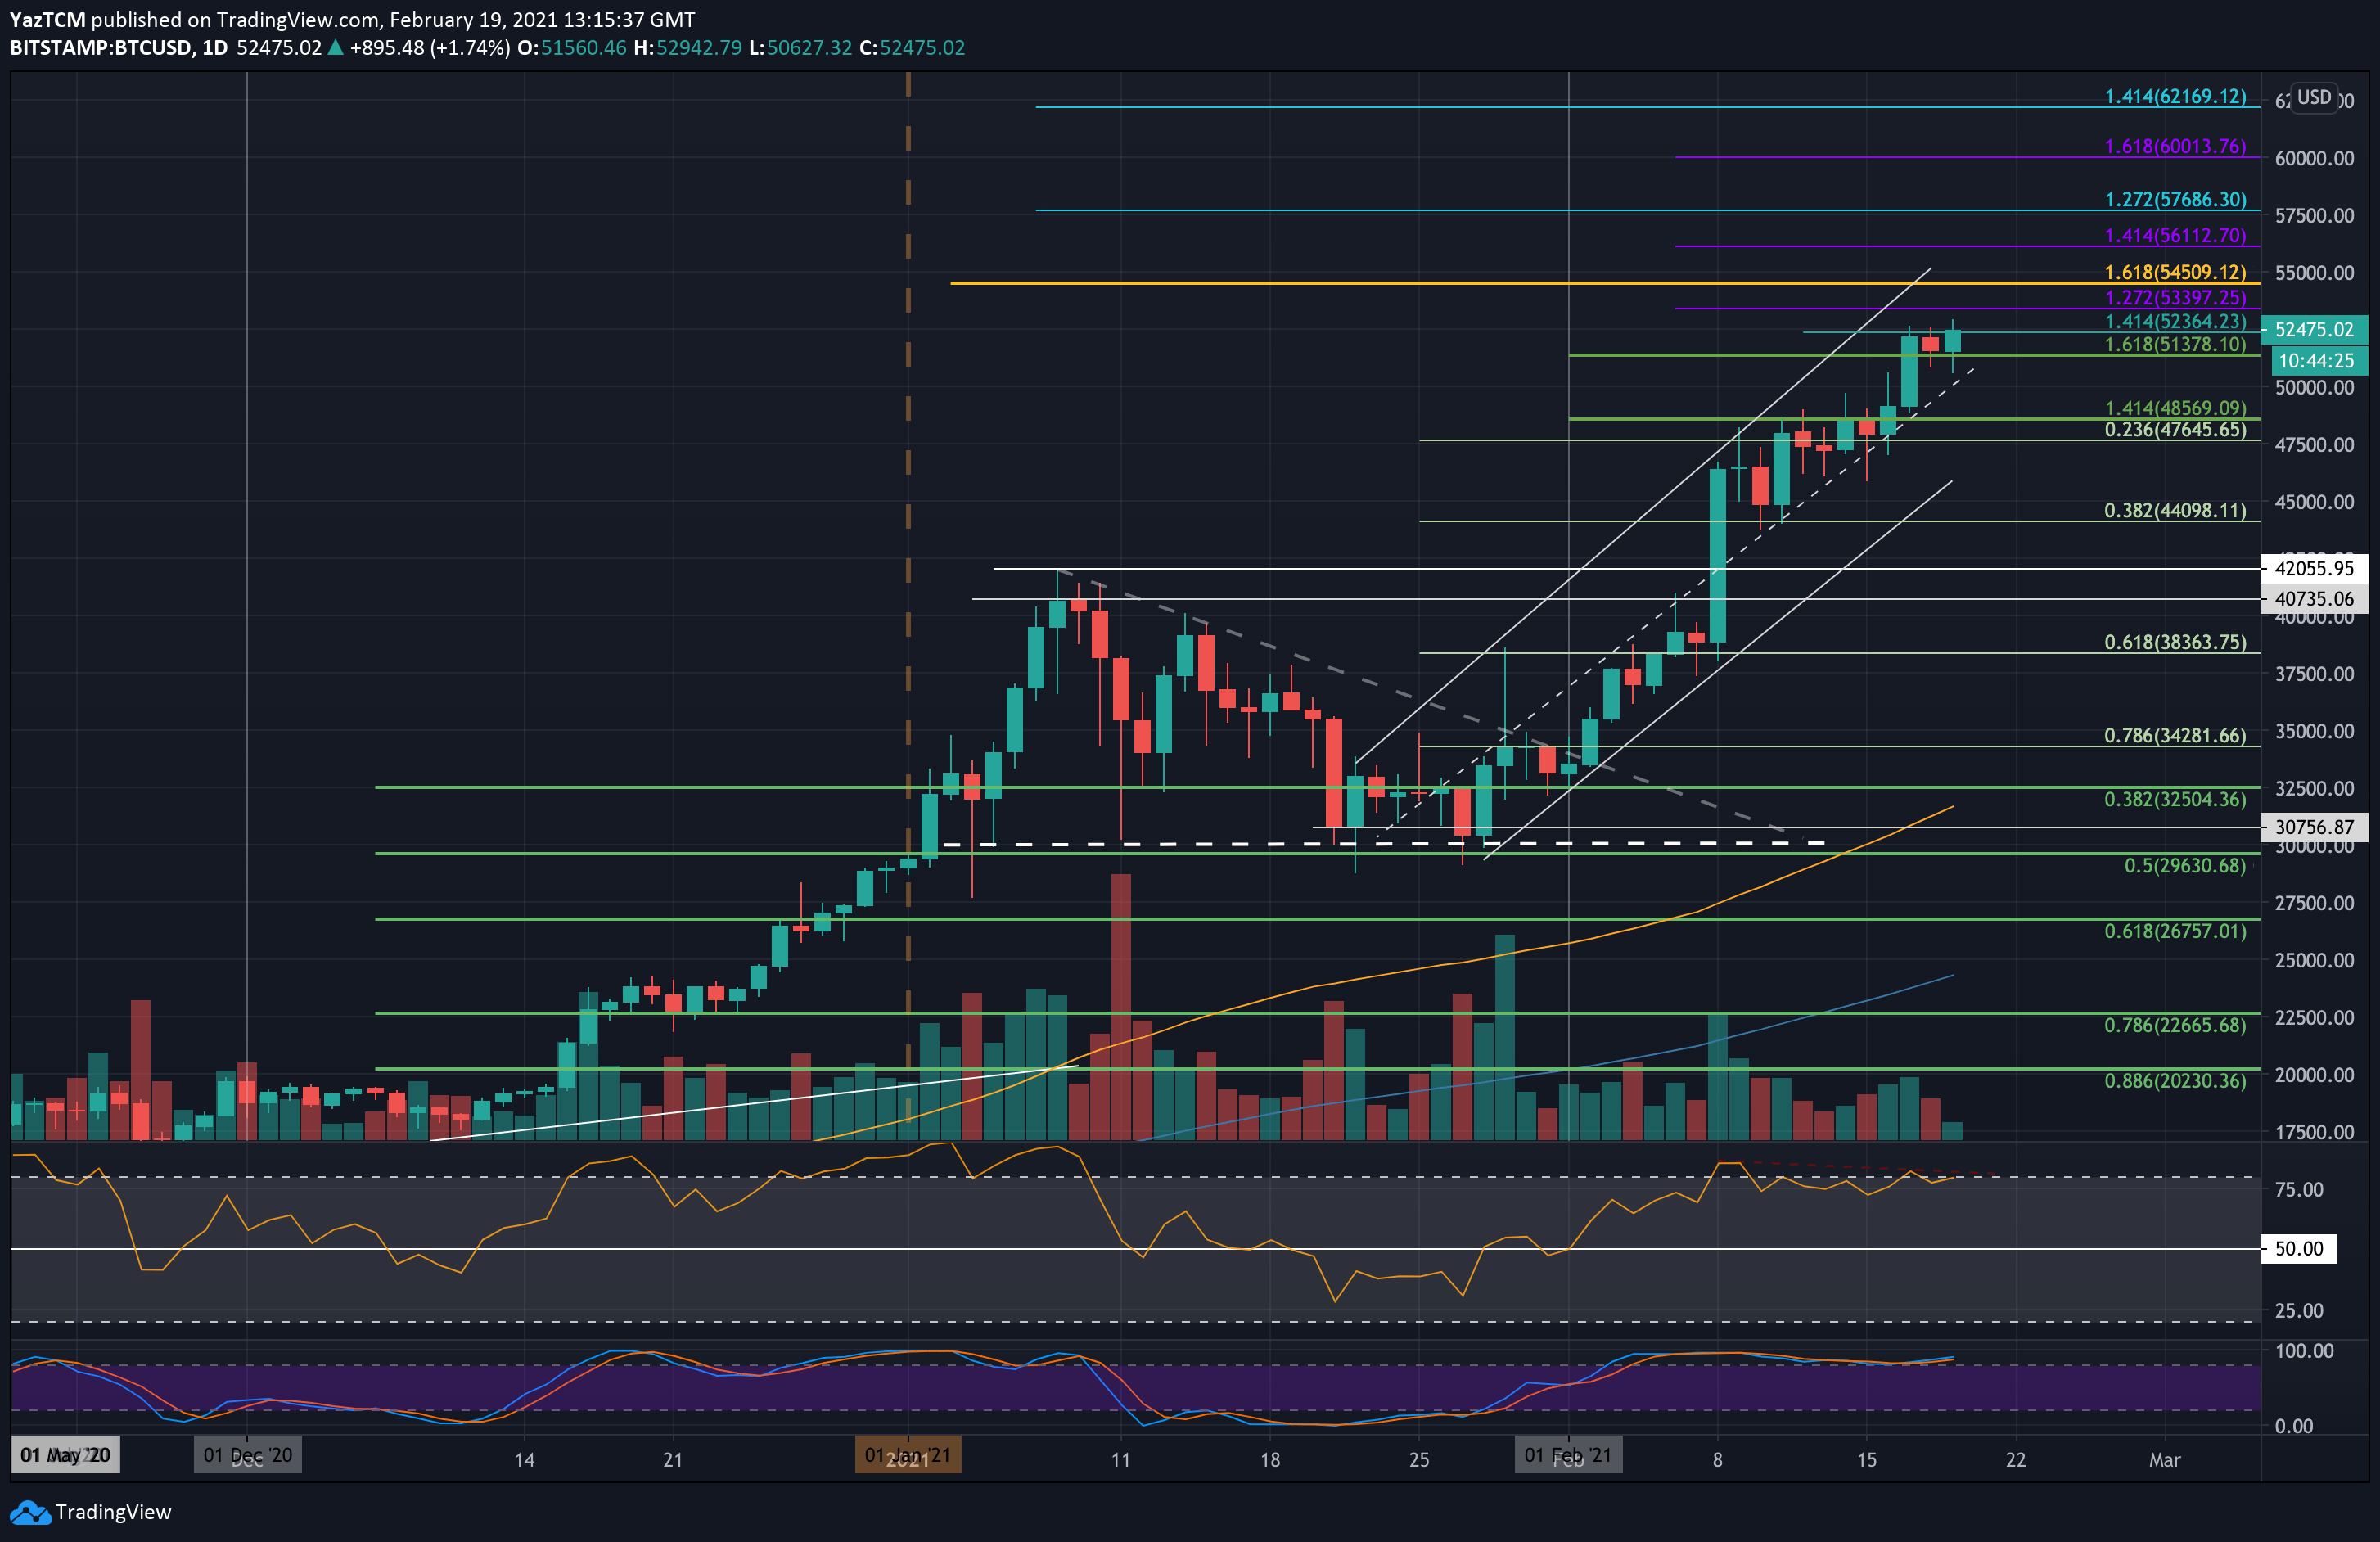
BTC Price Support and Resistance Levels to Watch
Key Support Levels: $51,378, $50,000, $47,645, $45,000, $44,100.
Key Resistance Levels: $52,365, $53K, $53,400, $54,500, $56,112, $57,686.
Looking beyond $52,365, the first level of resistance lies at $53K (current all-time high level), $53,400 (1.272 Fib Extension – purple). This is followed by $54,500, $56,112 (1.414 Fib Extension – purple), $57,686 (1.272 Fib Extensoin – blue), and $60,000.
On the other side, the first support is located at $51,378. This is followed by $50,000, $47,645 (.236 Fib & lower boundary of the price cahnnel), $45,000, and $44,100 (.382 Fib).
The daily RSI is showing minor hints of a bearish divergence, which can be seen on the following 4-hour chart. However, this has also been showing all week, and it seems unlikely to result in any major price declines.
Bitstamp BTC/USD Daily Chart
Bitstamp BTC/USD 4-Hour Chart