Bitcoin Price Analysis: BTC Retests The Critical $11,200 Zone, Another Price Plunge Coming Up?
Over the past three days, since breaking down the horizontal triangle formation, the trading surrounding Bitcoin was boring, as the coin was consolidating between $11,200 to $11,500 followed by low volumes.
As of writing this, Bitcoin is facing its third attempt amid the $11,200 support line. So far the past efforts held up the price region; however, the more attempts to breakdown the higher chances the support line will actually break. The $11,200 is also reflected on the $200 Billion market-cap price mark of the total Bitcoins.
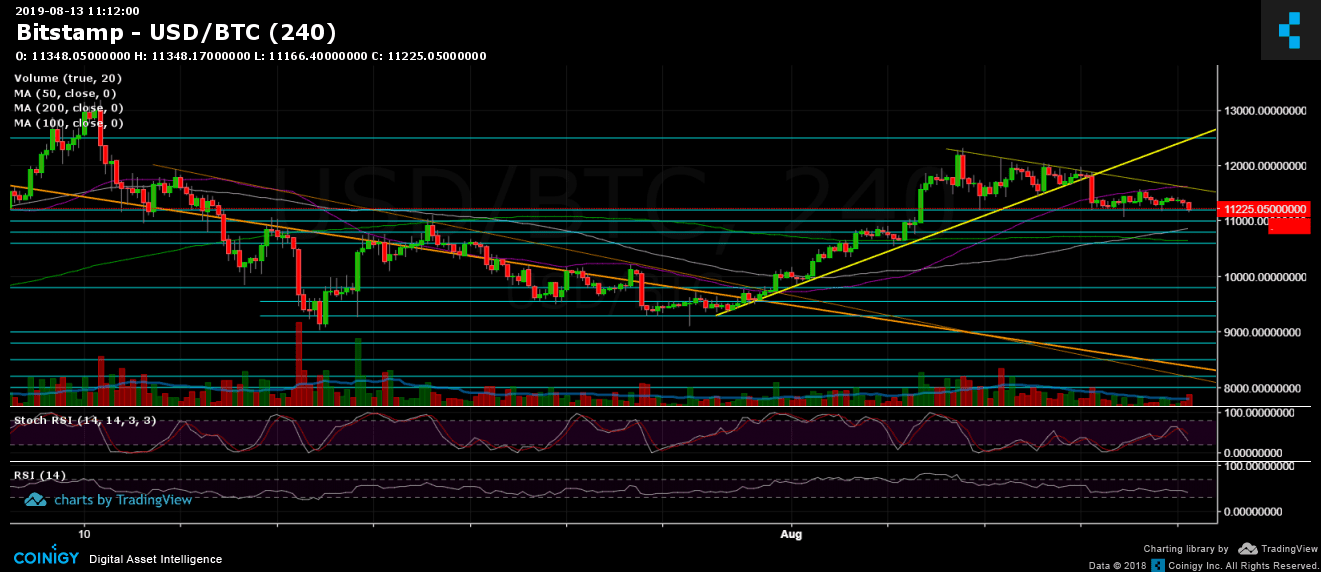
In case of a breakdown, the next significant support level is close by, around $10,800 – $10,900. The area contains the significant 50-days moving average line (marked purple on the following chart).
Looking on the bullish side, the next major area is the marked yellow line, which is the famous descending trend-line, which was started forming at 2019 high of $13,880.
Regarding the BTC dominance (and the altcoins accordingly), after touching 70% and retracing back to the current level of %68.7, there is no significant change. Hence, the alt-season is again postponed.
Total Market Cap: $293.4 billion
Bitcoin Market Cap: $201.1 billion
BTC Dominance Index: 68.7%
*Data by CoinGecko
Key Levels to Watch
– Support/Resistance:
As mentioned above, in the case of a breakdown, the nearest support level below $11K is $10,800 – $10,900. Further below lies $10,600 and $10,250 before the $10,000 mark. If BTC falls lower, then $9600 and $9400 might serve as possible support areas.
From above, the $11,500 – $11,600 level had been turned into resistance. This also contains the 4-hour’s triangle descending trend-line (marked by yellow). Above is the $12,000 and $12,300. The last was the recent days’ resistance zone.
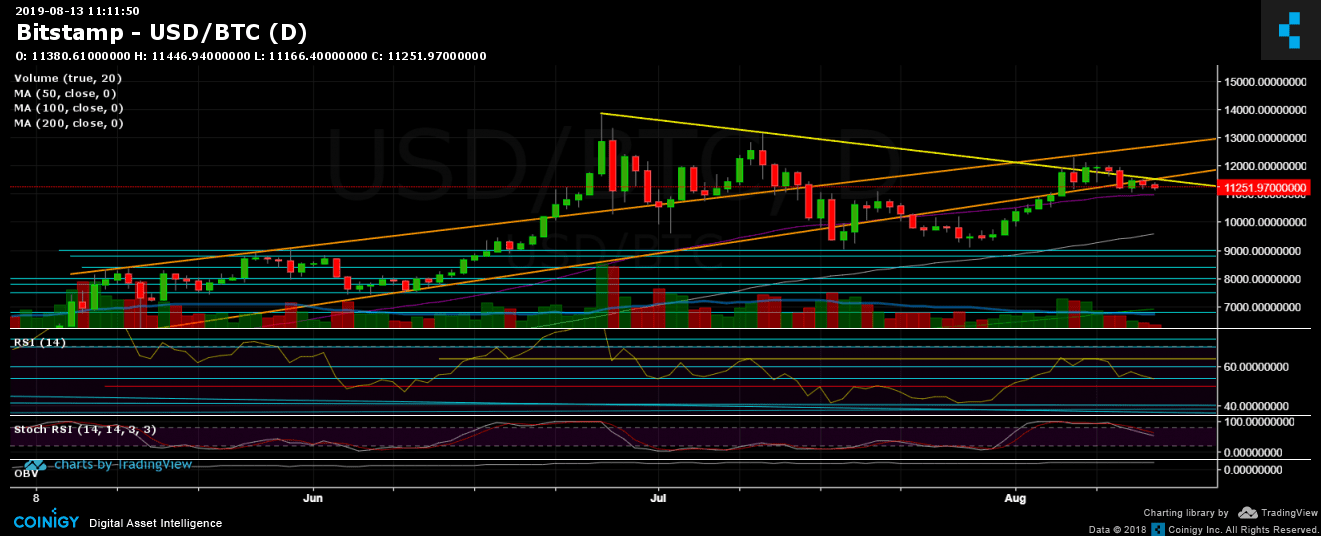
– Daily chart’s RSI: The support area is also reflected on the RSI, as the last facing the 54 horizontal support for the second time since Bitcoin broke down from the triangle. Bitcoin has more room to go lower, although staying above the 50 is still considered bullish.
– Trading Volume: Yesterday’s trading volume was probably the lowest since the end of April. This aligns with recent data showing crypto funds flowing out of the major exchanges.
BTC/USD BitStamp 4-Hour Chart
BTC/USD BitStamp 1-Day Chart
The post Bitcoin Price Analysis: BTC Retests The Critical $11,200 Zone, Another Price Plunge Coming Up? appeared first on CryptoPotato.