Bitcoin Price Analysis: BTC Is Fighting For $8000 – Here Is Something Crucial To Keep Your Eyes On
Since our recent Bitcoin analysis, we saw Bitcoin trading around the range of $7800 – $8200.
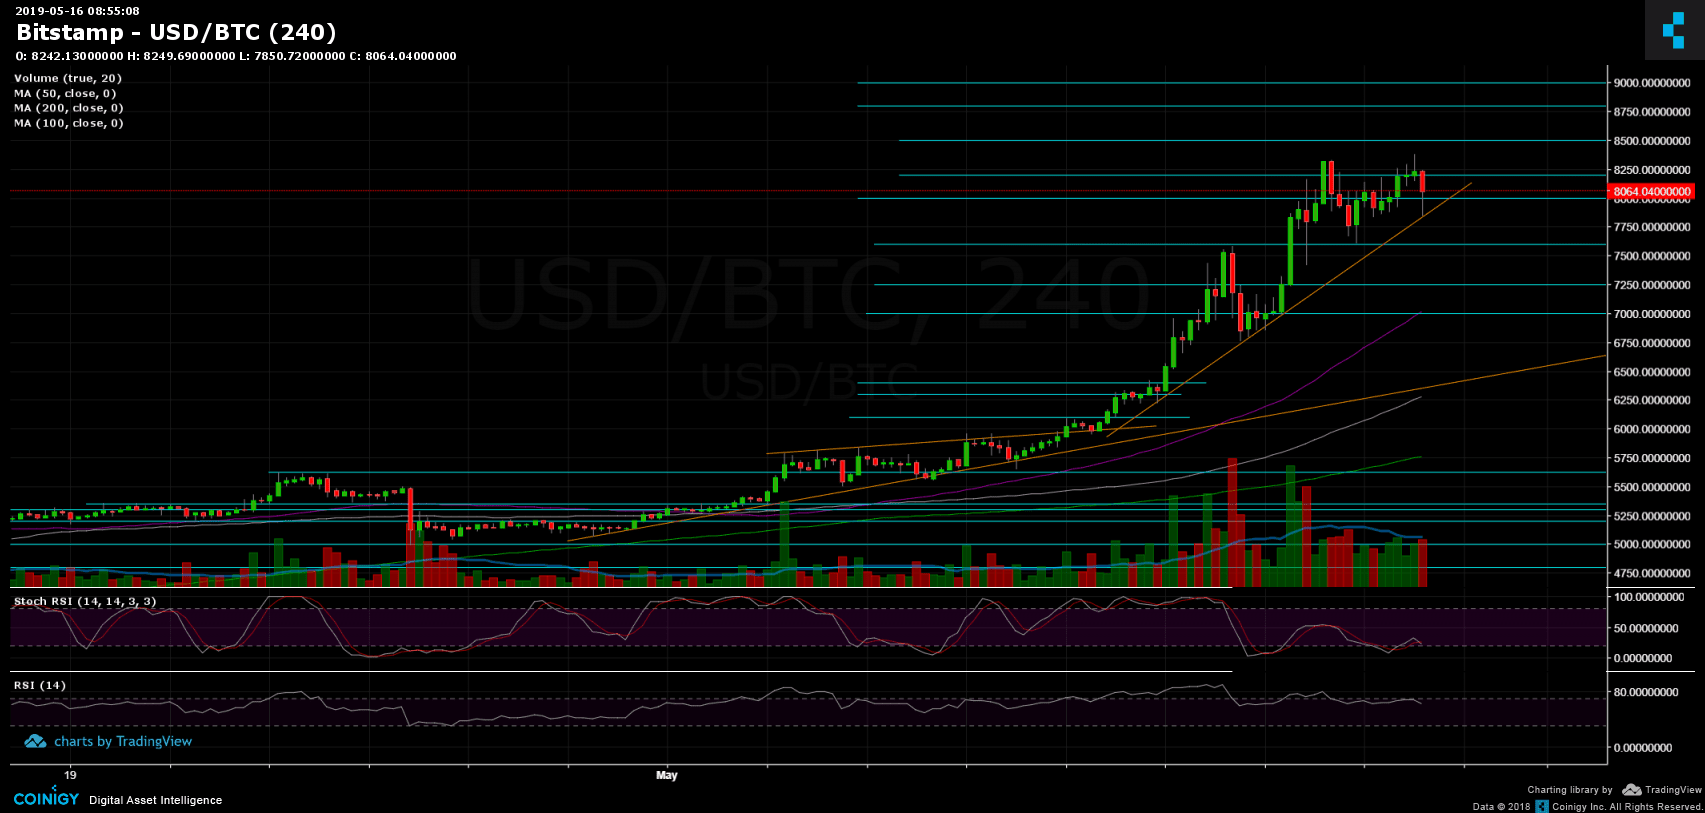
As can be seen on the 4-hour chart, Bitcoin gained momentum on its way up following an ascending trend-line which was tested (as support) one more time during the past hours.
Since breaking up the $6000, as mentioned in our last week’s market update, Bitcoin reached $8000 very quickly (six days) with no significant correction throughout the day.
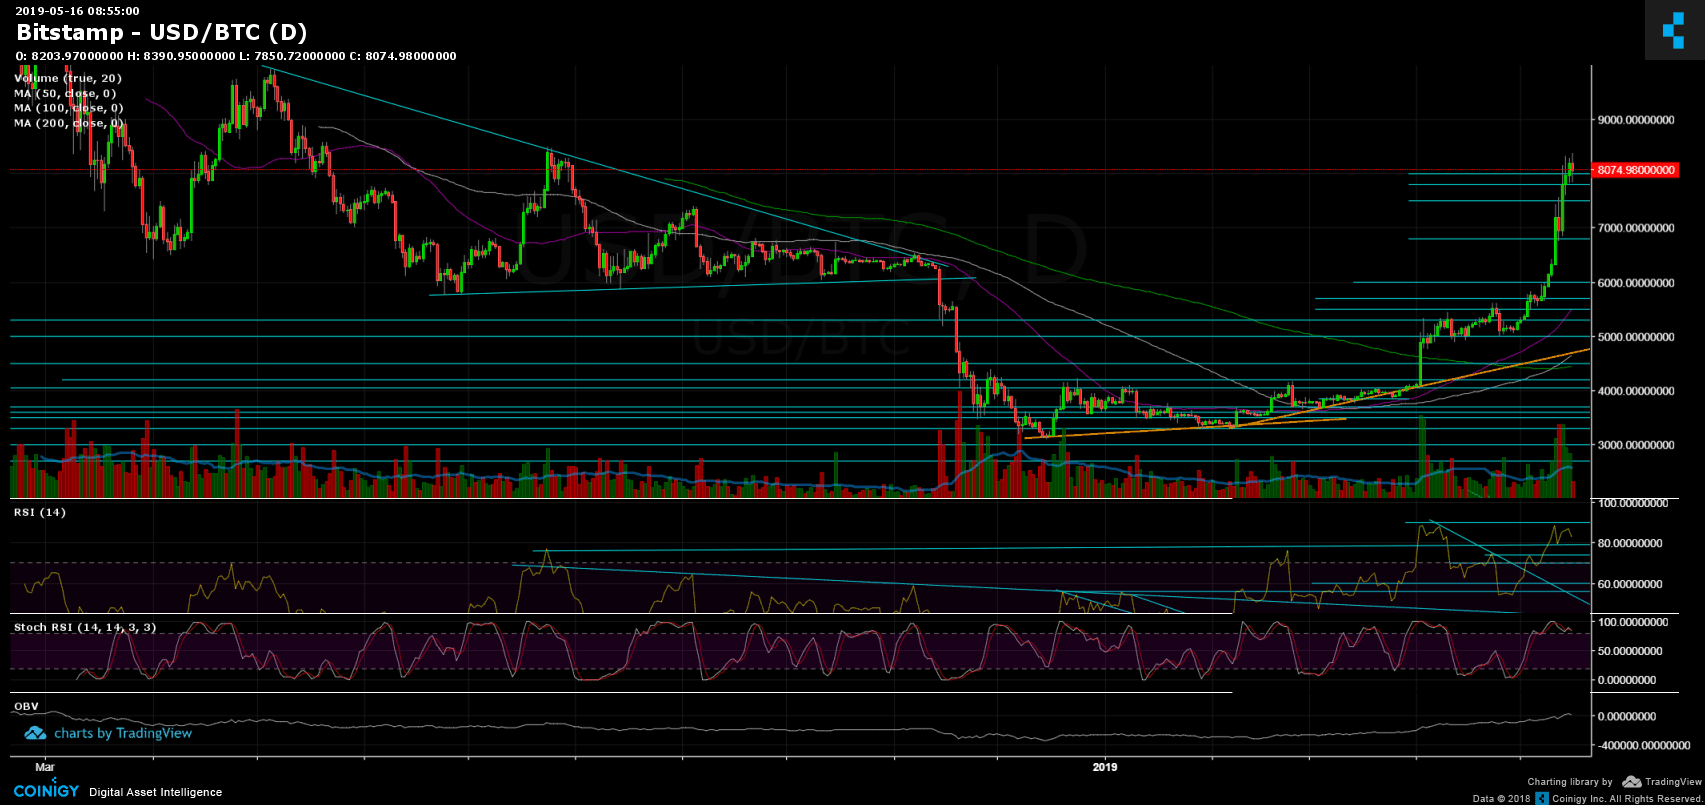
Looking at the critical Stochastic RSI oscillator of the daily chart, we saw a recent crossover pointing down in the overbought area; however, the RSI is still in the bullish territory. In case it will get into the bearish area, we would expect a deeper correction for the next days. We are not the only one thinking such correction could be healthy for Bitcoin in the longer term, as we recently heard that from the crypto influencer Tone Vays.
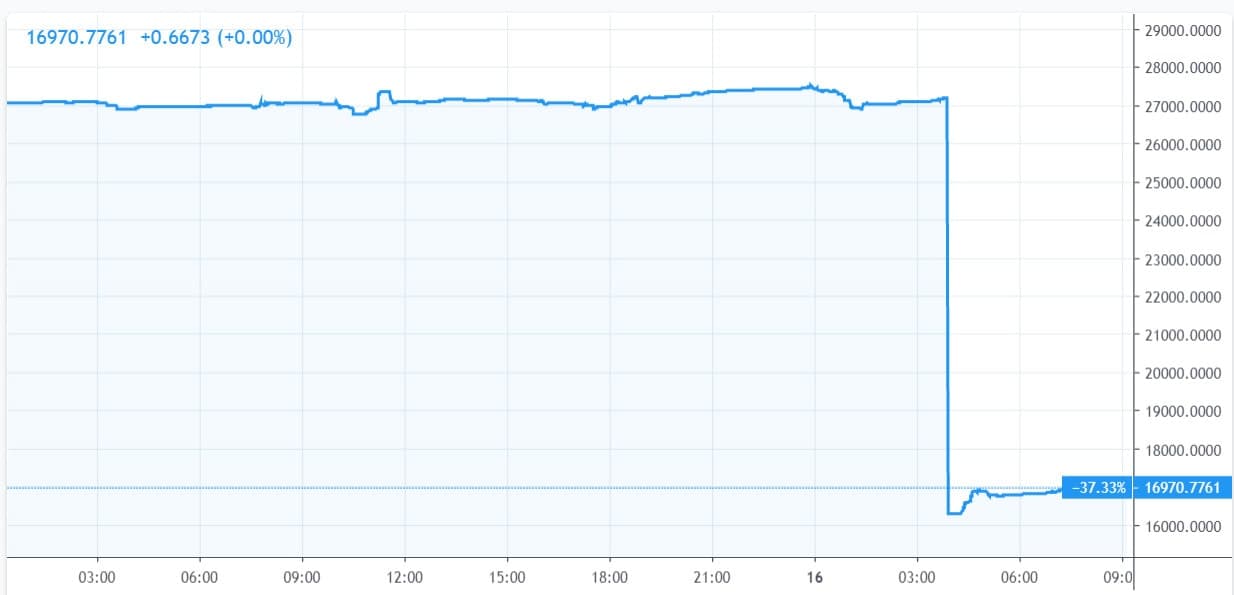
Add to that a recent significant drop in the short positions caused a daily 38% decrease, as the short positions are now at their lowest point over the past year. The number currently stands around 17K BTC open short positions. As a reminder, a situation where shorts are at their lower levels and longs at their high create the perfect settings for a long-squeeze.
Besides, we like to say, ‘expect the unexpected.’ Everyone, including us, expected a Bitcoin move by the time Binance opens back its withdrawals. As can be seen, nothing significant happened, as the market dropped just a little.
Total Market Cap: $255 Billion
Bitcoin Market Cap: $142.5 Billion
BTC Dominance: 55.9%
Looking at the 1-day & 4-hour charts
– Support/Resistance:
Bitcoin is struggling to keep up the $8000: In case it breaks down, the next level of support is likely to be the mentioned ascending trend-line (marked in orange). Below is the $7800 support, and $7600. Further down lies $7250 and $7000.
From the bullish side, $8200 – $8300 serves as the nearest resistance level, while $8500, $8800 and $9000 are further resistance.
– Trading Volume: Money is getting in – the market cap is rising over the past day as money is getting into the altcoins. In general, the volume in the crypto exchanges skyrocket, as well as traditional exchanges such as CME.
– Daily chart’s RSI: The RSI encountered resistance at 88-90 and got rejected. However, the current level is still high in the bullish territory.
– BitFinex open short positions: mentioned above – the number currently stands around 17K BTC open short positions.
BTC/USD BitStamp 4-Hour Chart
BTC/USD BitStamp 1-Day Chart
The post Bitcoin Price Analysis: BTC Is Fighting For $8000 – Here Is Something Crucial To Keep Your Eyes On appeared first on CryptoPotato.