Bitcoin Price Analysis: BTC Heads Lower on BitMEX News. Will $10K Hold?
Bitcoin’s price continues to tumble in response to yesterday’s breaking news that the United States Commodity and Futures Commission (CTFC) and the Federal Bureau of Investigation (FBI) have both decided to take legal action against leading Bitcoin derivatives exchange, BitMEX.
$18 billion has been wiped out from the global crypto market since the announcement, and over $20.3 million worth of long positions have been liquidated on BitMEX.
There’s also talks that the market decline could have been inadvertently fuelled by US President Donald Trump testing positive for COVID-19.
Overall, however, Bitcoin has fared reasonably well all things considered. Despite a flurry of bearish catalysts, the leading crypto is only down 4.23% at press time and is still continuing its record stint above $10,000.
Price Levels to Watch in the Short-term
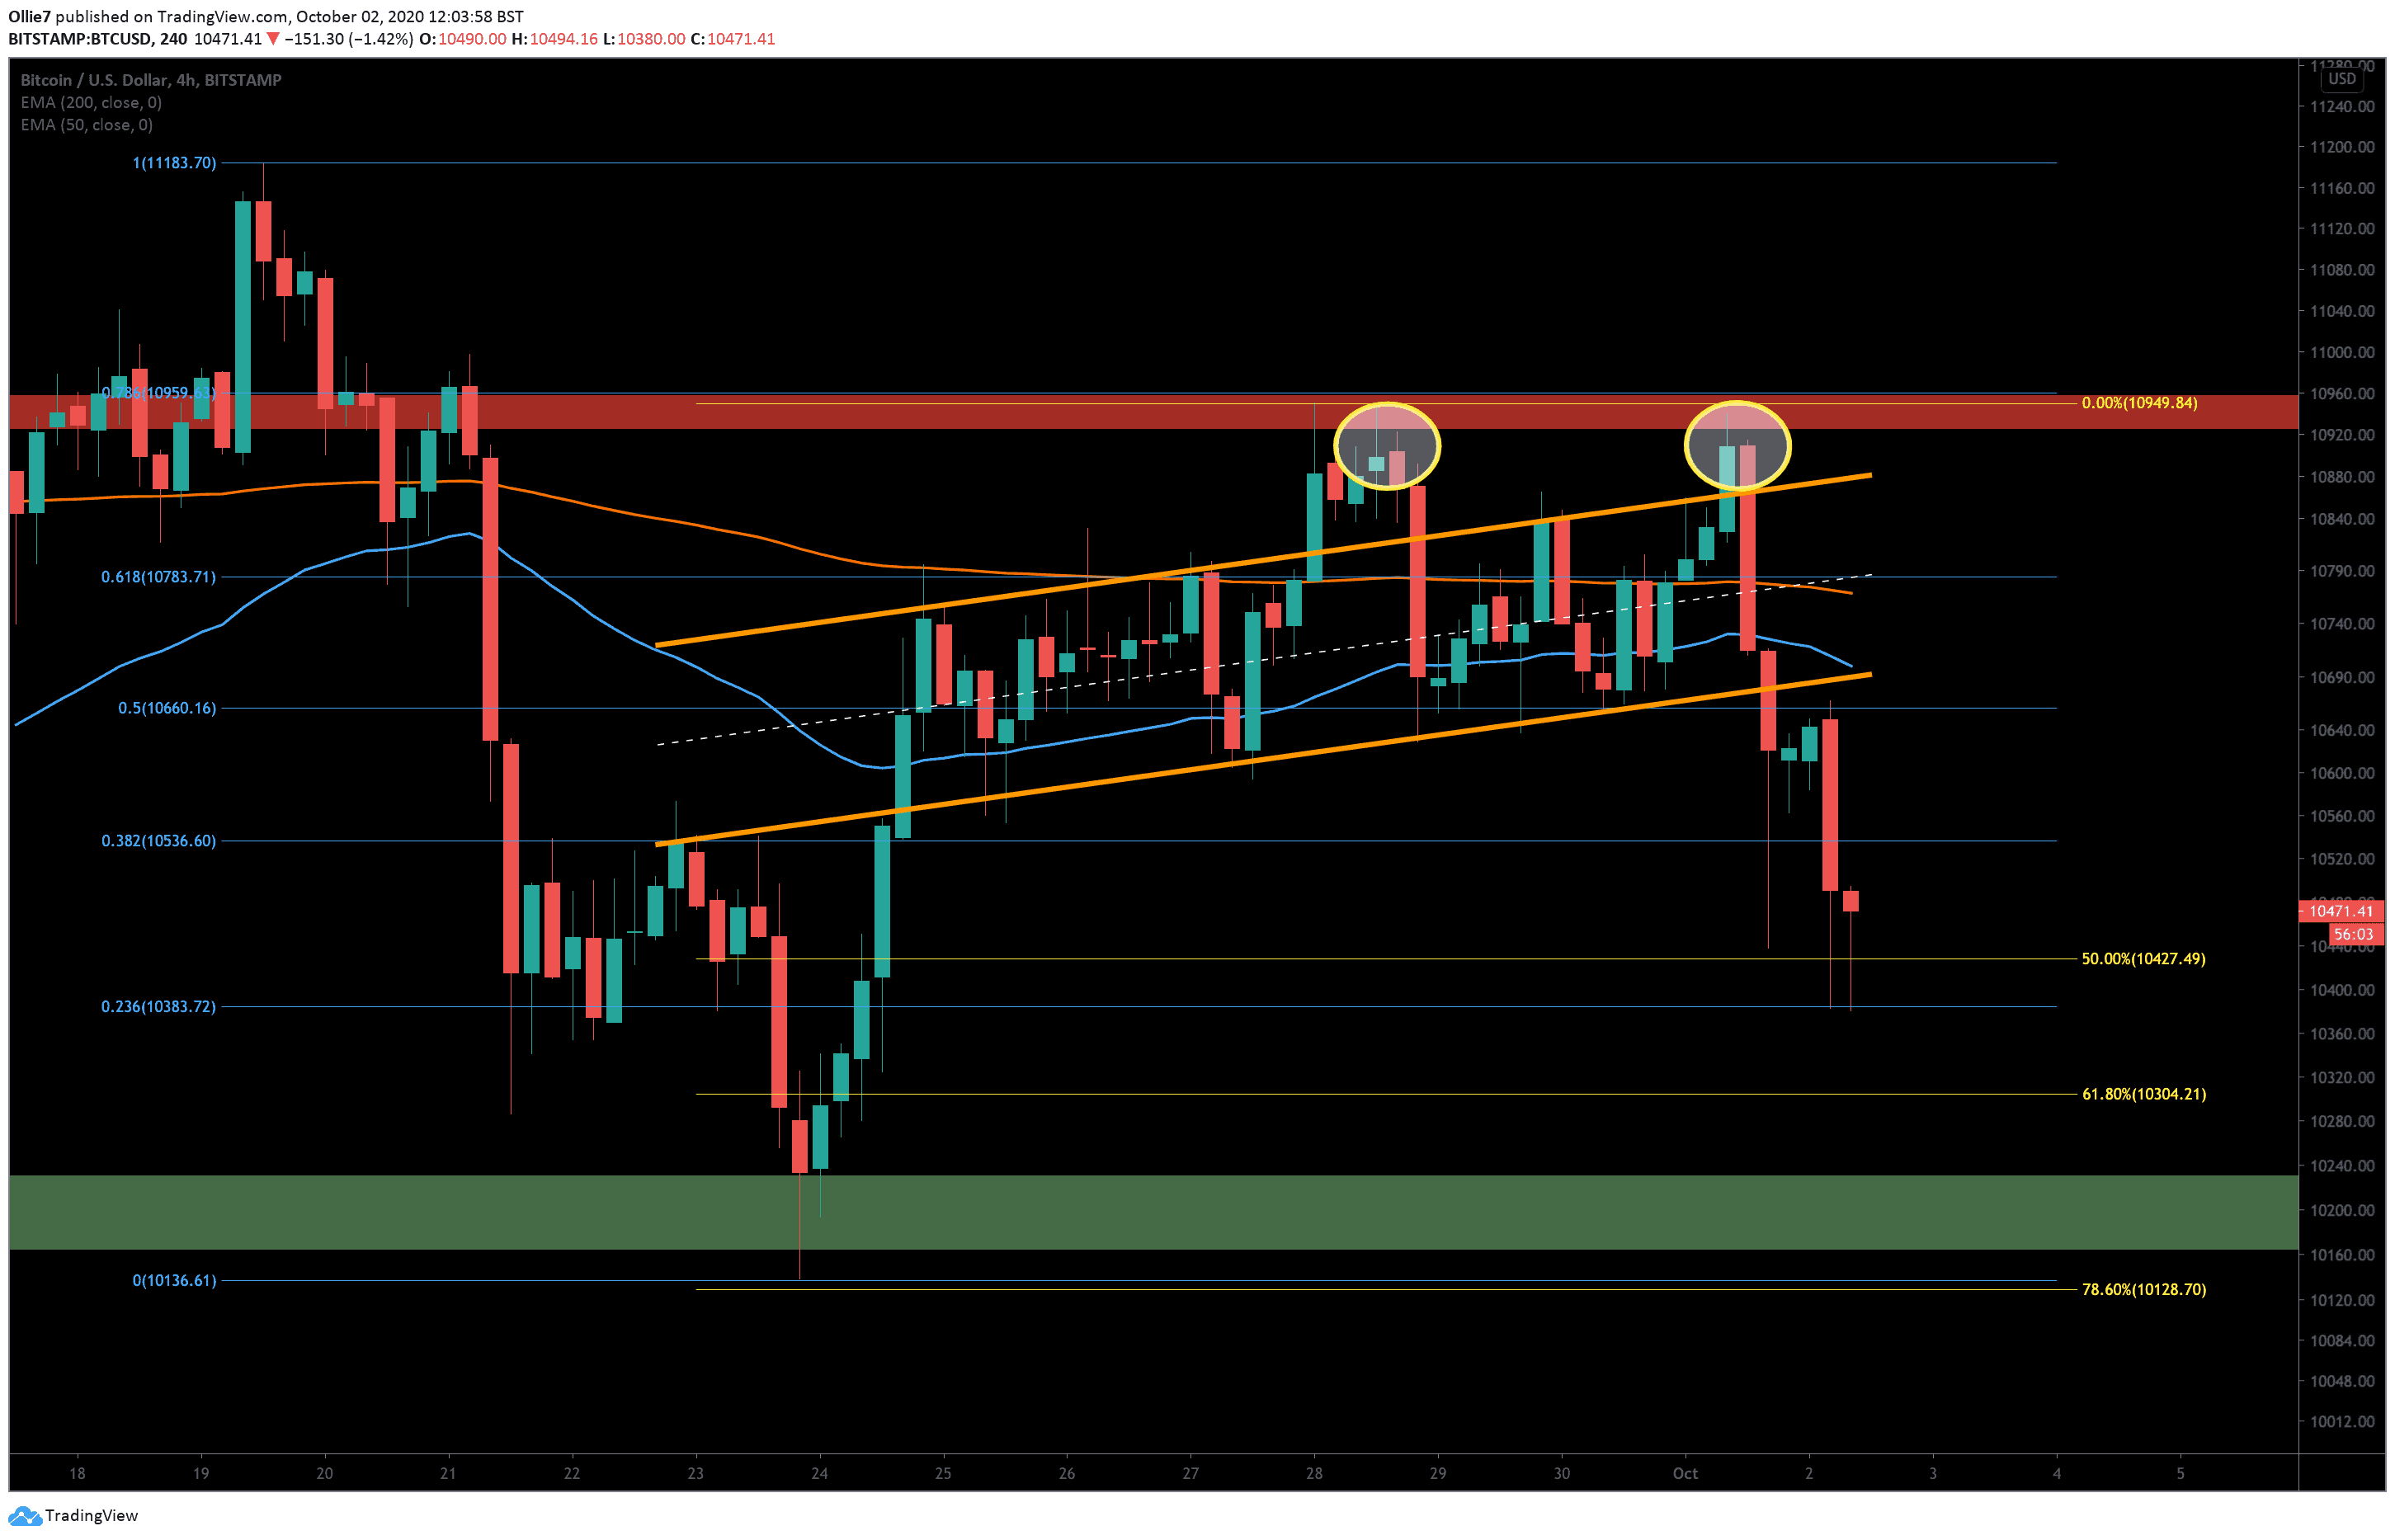
On the 4-hour BTC/USD chart, we can see that the steep crash coincided with a bearish double top pattern after BTC failed to close above the $10,900 level for a second time (yellow circles).
This will have also flashed a “sell” signal to traders and added to the panic that was already building in the market. Once the crash was underway, we can see that the 50 and 200 EMA lines provided little defense against the tanking price. Only the 0.236 Fibonacci level at $10,383 was able to completely put a stop to the fall.
Looking at the price action now, it’s clear that bullish traders have managed to reclaim $10,430 but are still facing heavy selling pressure as weaker hands exit out of the market.
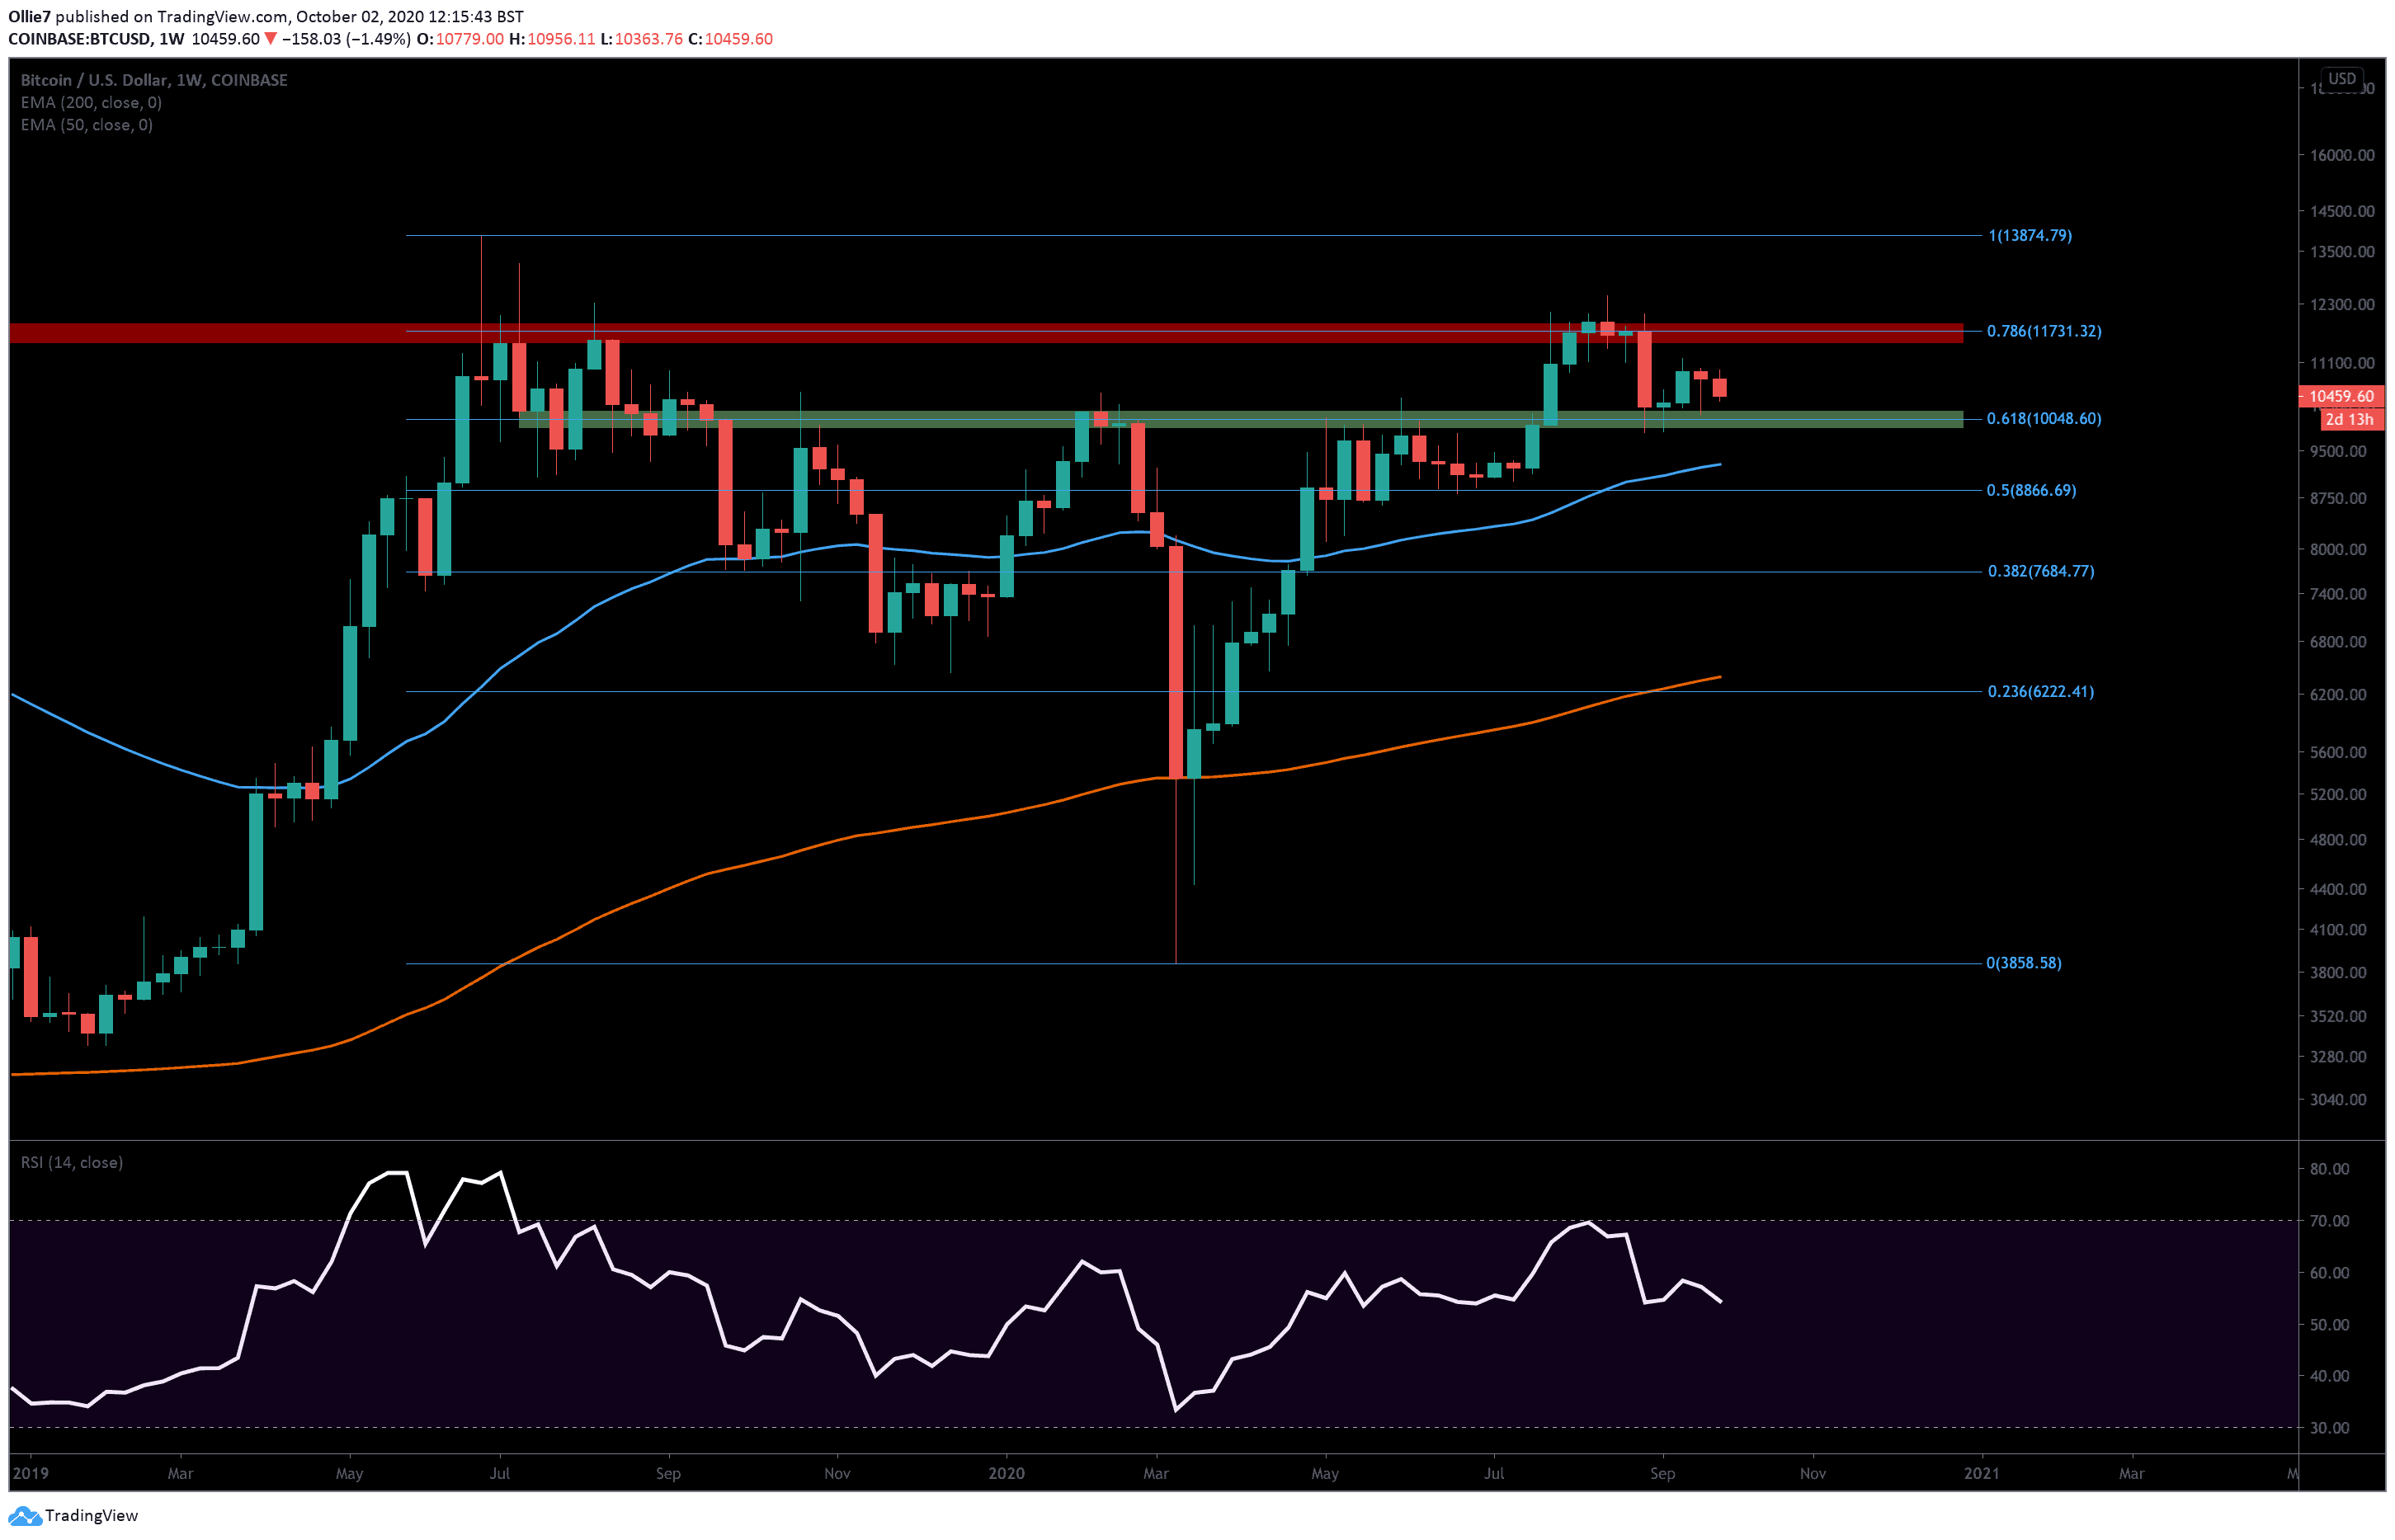
There’s a strong support zone on the weekly chart (green zone) between $10,170 and $9,925 that has been a key S/R level historically for bitcoin. This area also overlaps with the 0.618 Fibonacci level around the $10,000 level. If selling momentum continues, we should anticipate this area to provide a solid foothold for bullish traders to relaunch from.
There’s also another critical weekly S/R level at $9,750, which may see a reaction if prices break under five figures and bears attempt to close the unfilled CME gap ($9,925 – $9,665.)
Total market capital: $336 billion
Bitcoin market capital: $193 billion
Bitcoin dominance: 57.6%
*Data by Coingecko
Bitstamp BTC/USD Weekly Chart
Bitstamp BTC/USD 4-Hour Chart
The post Bitcoin Price Analysis: BTC Heads Lower on BitMEX News. Will $10K Hold? appeared first on CryptoPotato.