Bitcoin Price Analysis: BTC Facing Decision Point Today, Goodbye Party For $8000 Starting Now?
Since the massive price drop at the beginning of this week, and for the past three days, Bitcoin is trading a little above the $8000 support area.
This $8000 support line is getting its strength from the 78.6% Fibonacci level, along with the mid-term ascending trend-line and the historic price support area of $8000.
From the bullish perspective, the fact that the $8K support had held for the last three days might become a ground for a positive correction; however, the bulls anticipating that correction long enough to say that if it didn’t take place until now – it might not come at all, as BTC loses momentum.
Looking on the following charts, Bitcoin will soon have to make a critical decision facing the mid-term ascending trend-line, along with a short-term descending trend-line.
Total Market Cap: $221 billion
Bitcoin Market Cap: $146 billion
BTC Dominance Index: 66.2%
*Data by CoinGecko
Key Levels to Watch
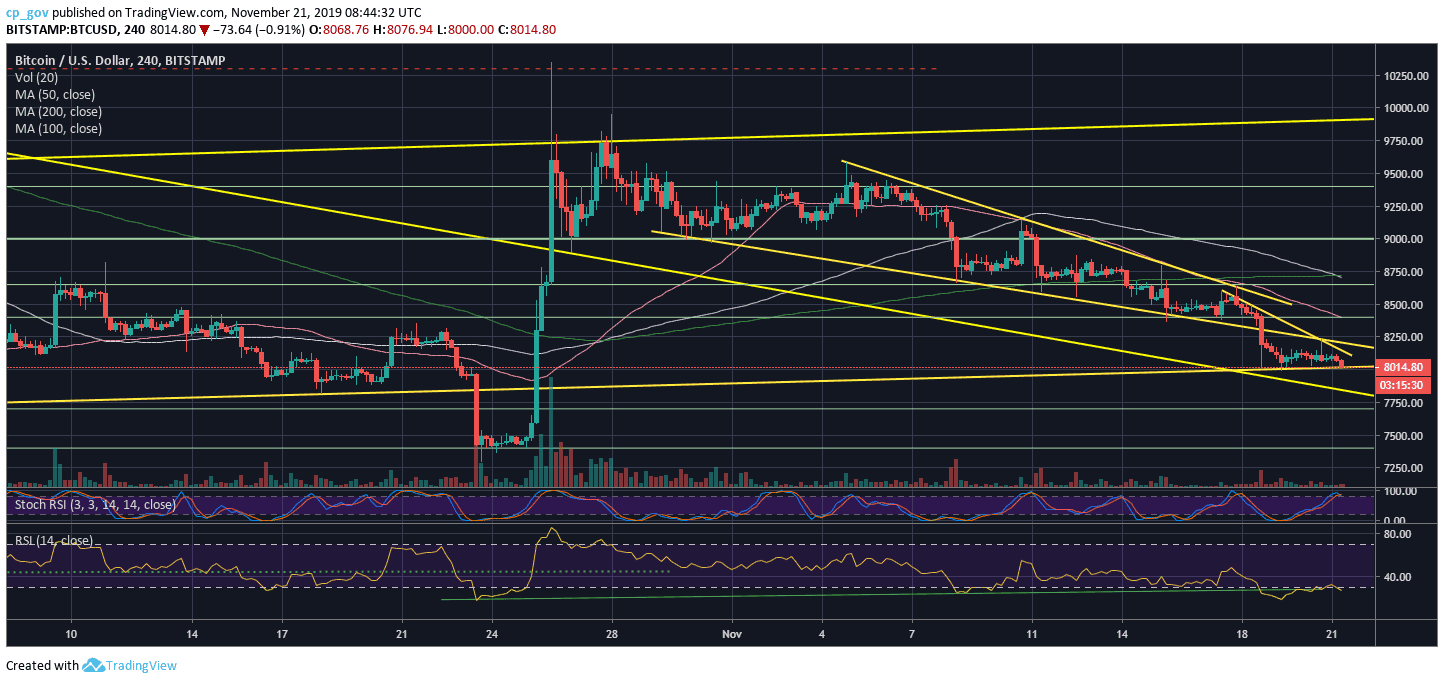
– Support/Resistance: Same as the last three days, the first level of support is $8000. In case Bitcoin breaks down, then the next support lies around $7700 – $7800. If the last doesn’t hold, then $7400 is the next target, which is Bitcoin’s lowest prices since the parabolic move of June 2019.
From above, if a correction takes place, Bitcoin will face $8200 as the first possible target (descending trend-line), whereas the next resistance area is the $8300 – $8400 zone.
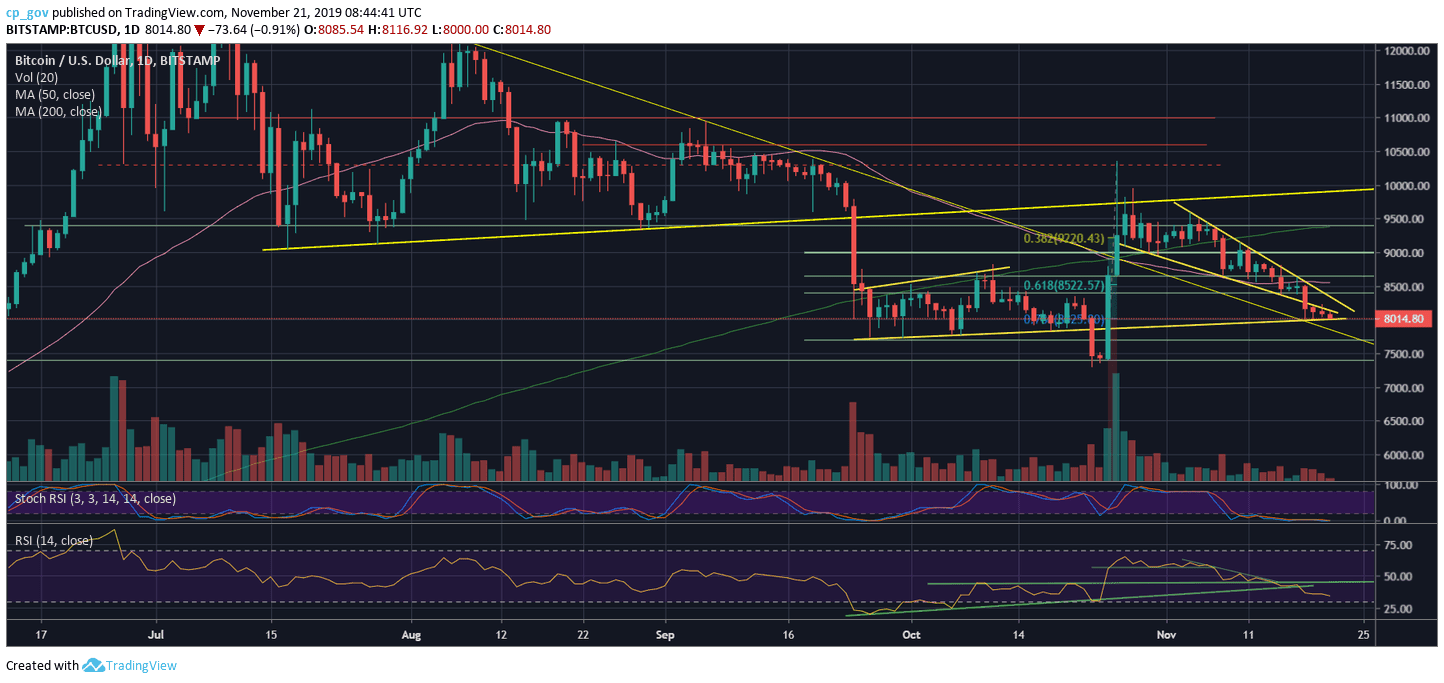
Further above is the $8500 area – which is the wedge’s descending trend-line, along with the 50-days moving average line (marked pink on the following daily chart).
– The RSI Indicator: There is no good news here for the bulls – the RSI looks very bearish, heading to the 30 level as of writing theses lines.
Stochastic RSI oscillator is pointing on oversold on the 1-day chart (for the past ten days already). This can lead to a possible positive correction in the case of a cross-over.
– Trading volume: The market makers are not here yet – the trading volume following the recent days’ action is minimal, very low compared to the monthly average.
BTC/USD BitStamp 4-Hour Chart
BTC/USD BitStamp 1-Day Chart
The post Bitcoin Price Analysis: BTC Facing Decision Point Today, Goodbye Party For $8000 Starting Now? appeared first on CryptoPotato.