Bitcoin Price Analysis: BTC Eyes New ATH Following $10K Weekly Surge
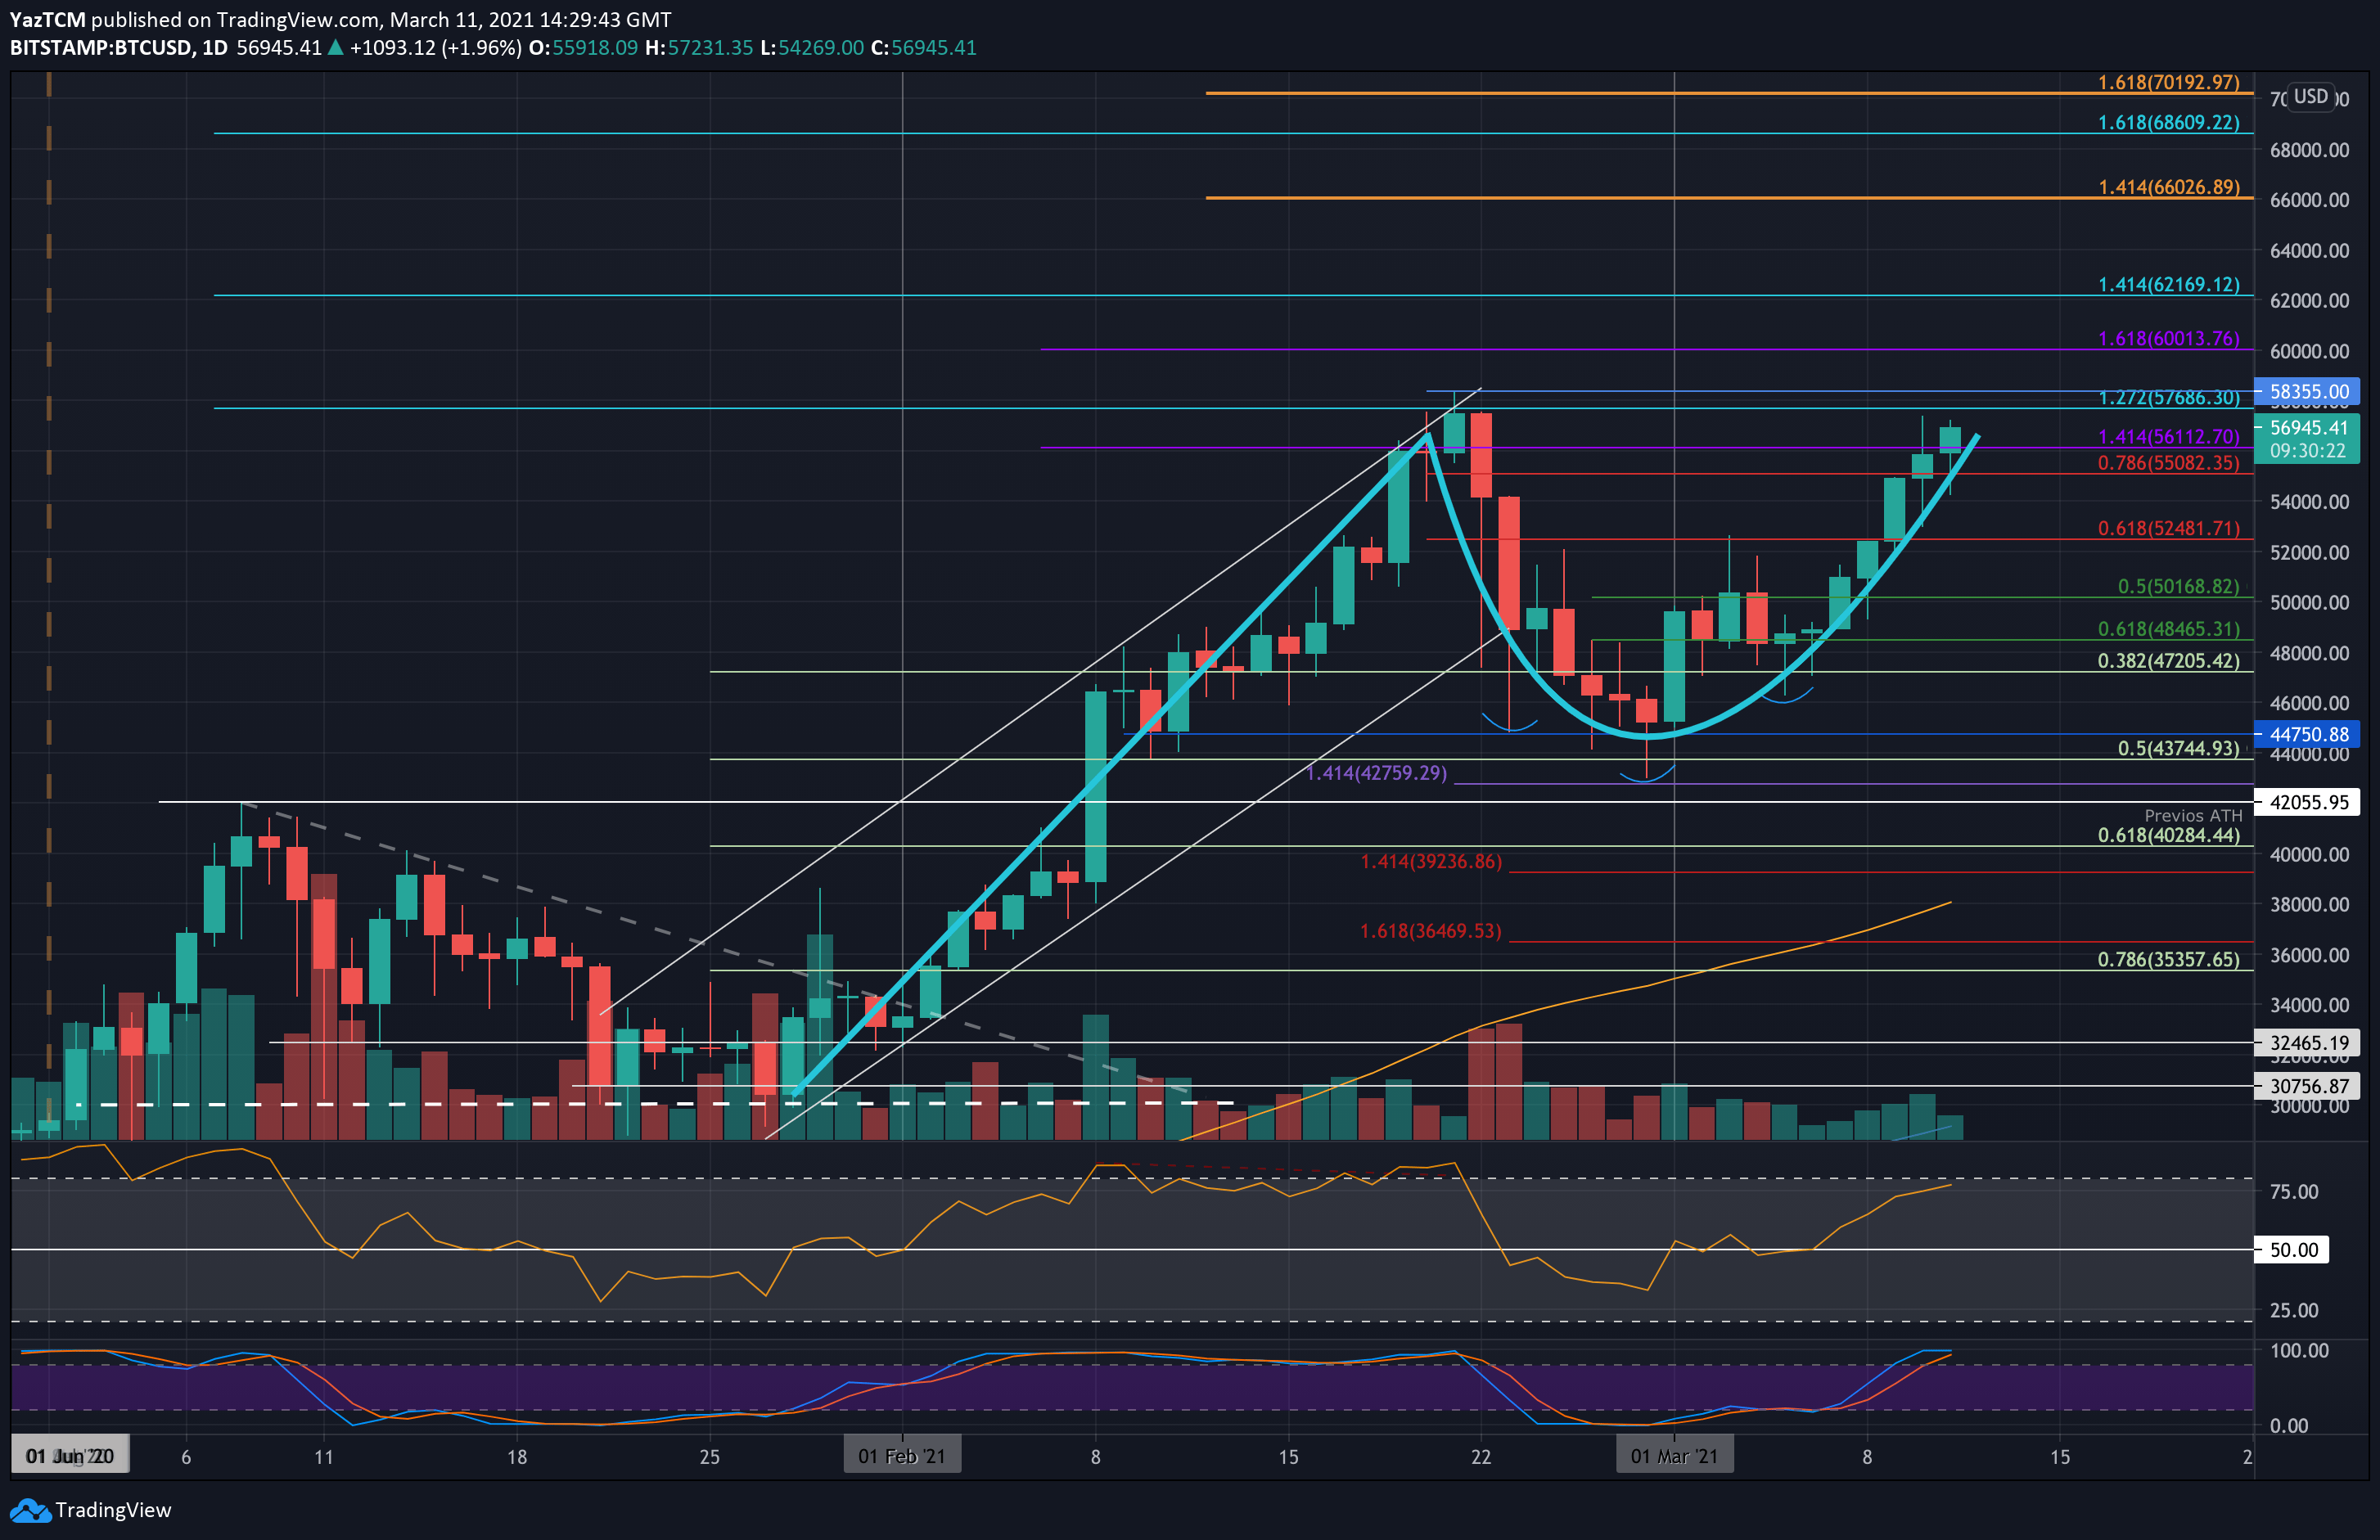
Bitcoin is up by a solid 12.5% over the past week of trading as it reached $57,400 as of today’s high. This is just about $1000 from the ATH recorded on February 21, 2021.
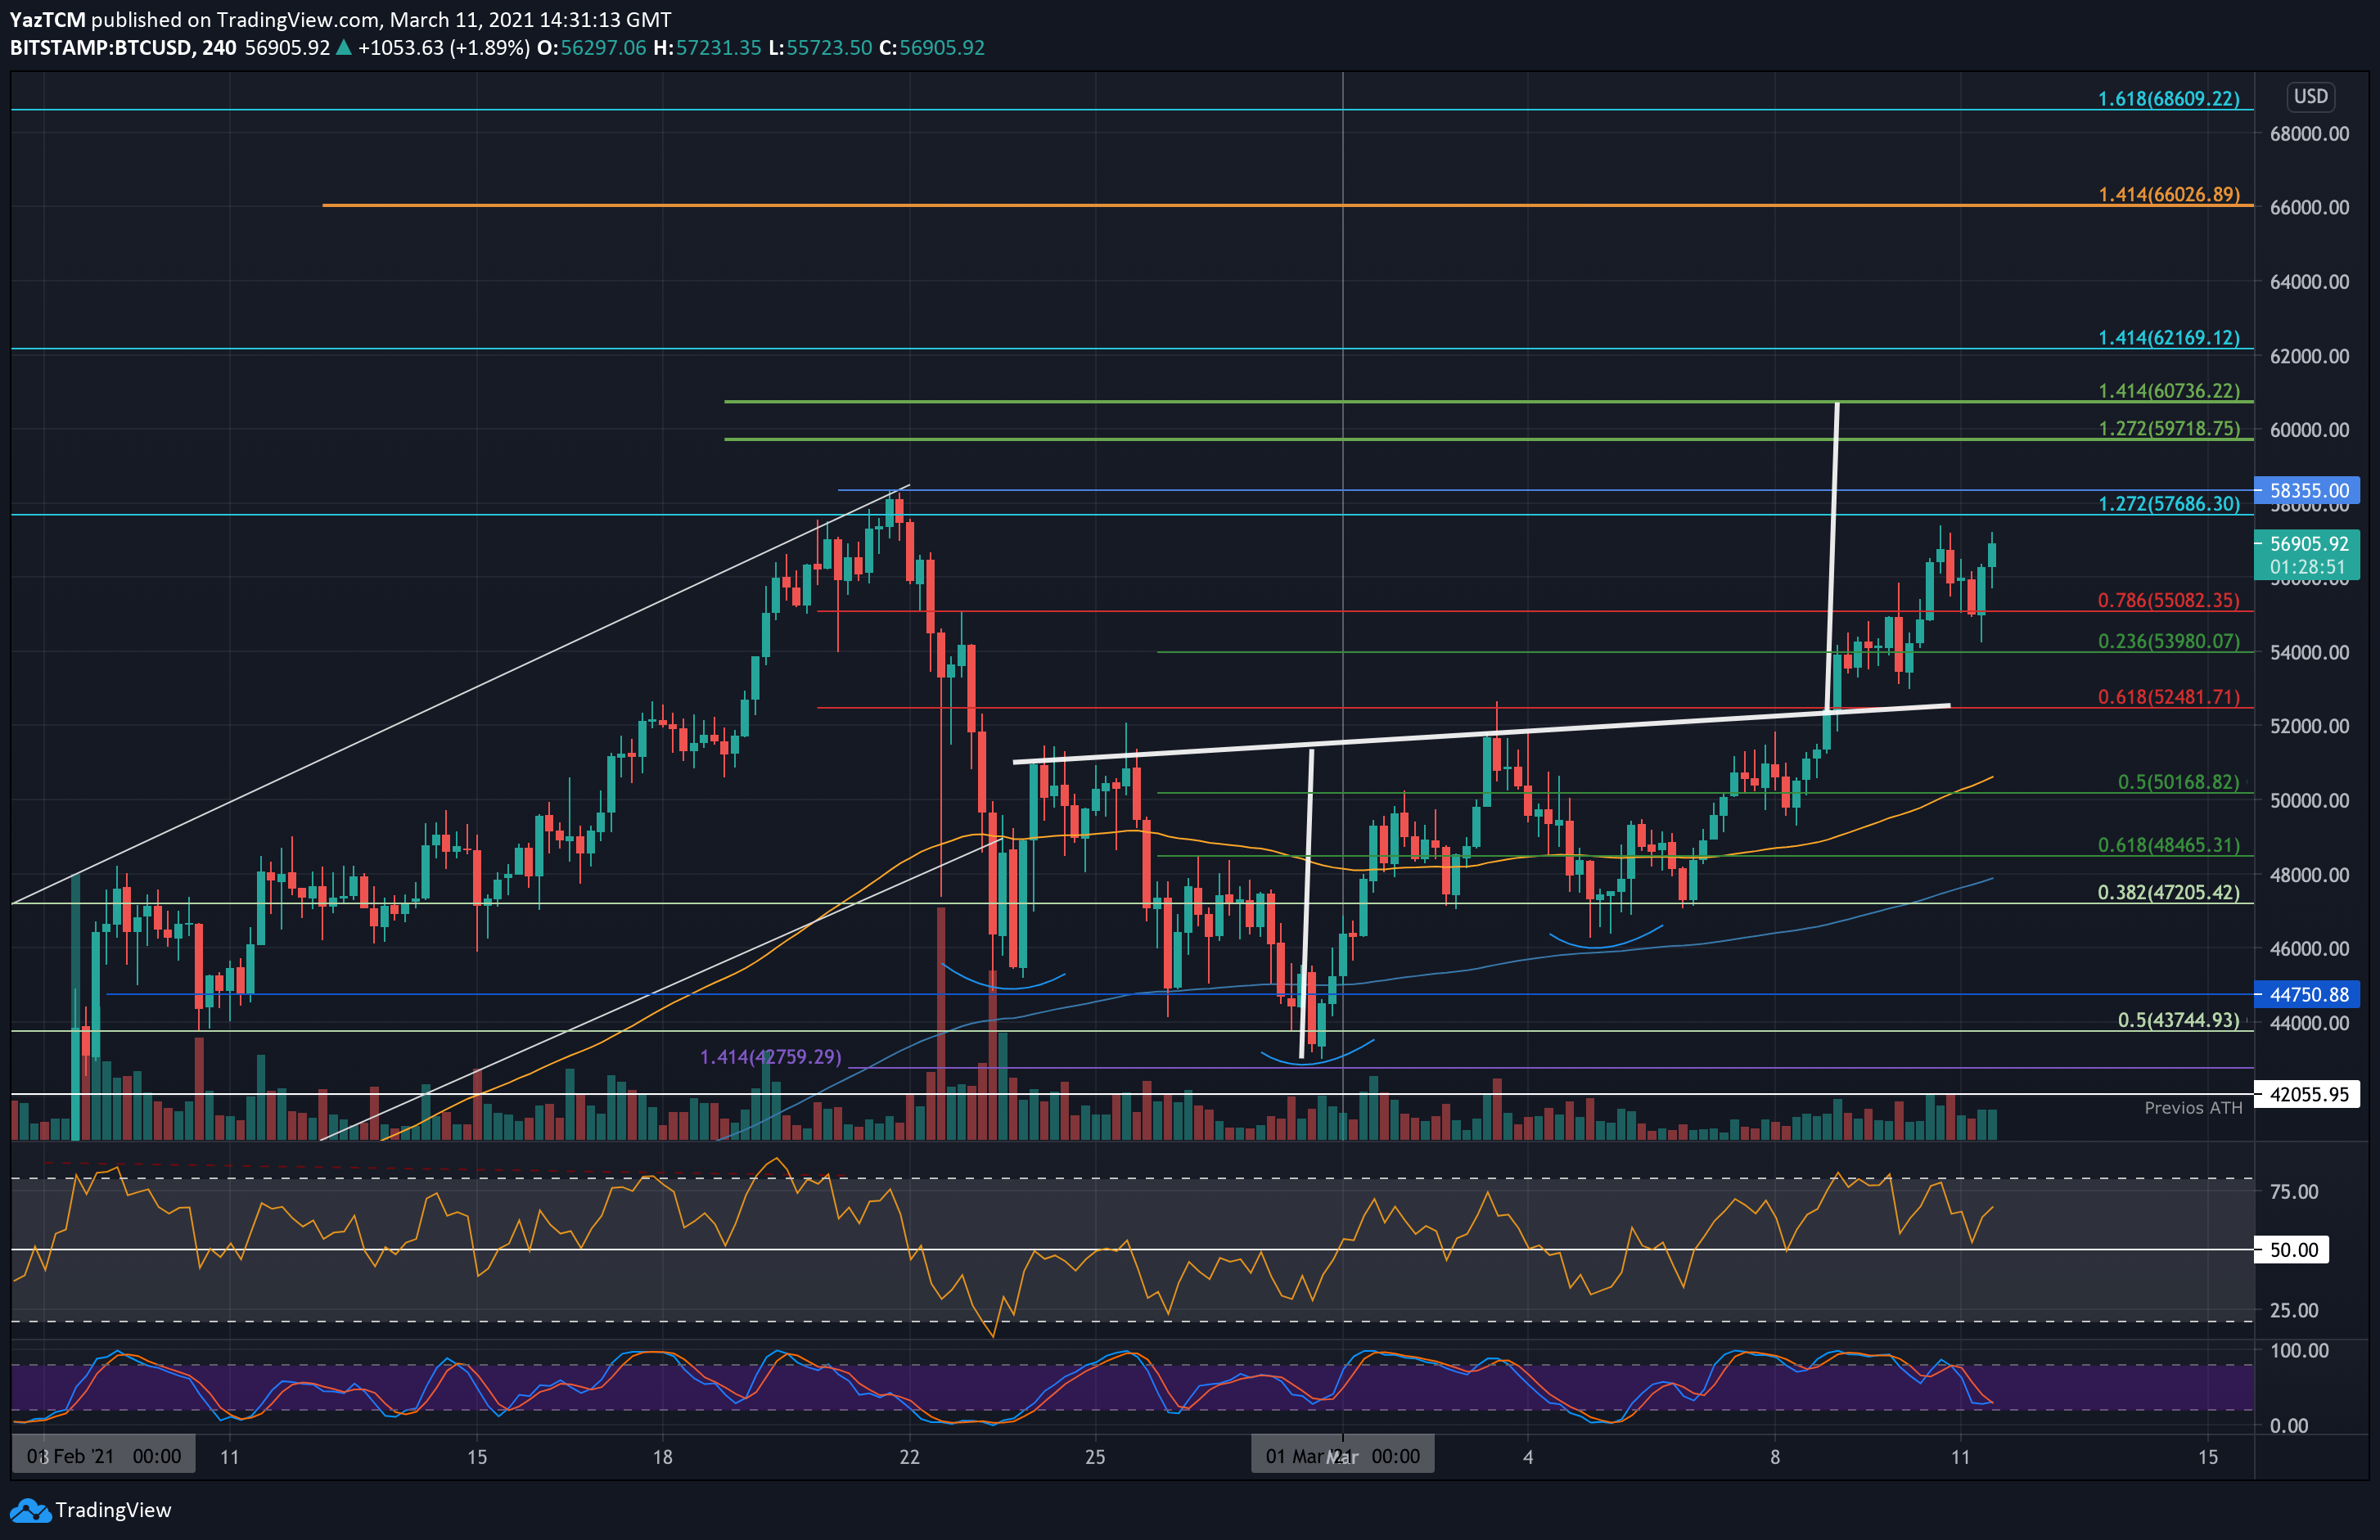
A quick recap: Bitcoin was trading inside an ascending price channel throughout February until it hit the ATH price of $58,355 (Feb-21). From there, it headed lower sharply as the price collapsed beneath the price channel and fell into the support zone around $43-44K by the end of the past month.
During the first days of March, Bitcoin attempted to push higher but couldn’t break the critical resistance around $52,480 (bearish .618 Fib). After another retrace to the demand zone at $47-48K last week, Bitcoin finally managed, on the second attempt, and surged past the $52K resistance on Tuesday.
After 48 hours of bullishness, Bitcoin is now threatening to break the ATH level and maybe eye $60K. Yesterday’s closing candle ($55,850) was the 4th highest on record, according to Bitstamp. In 6 days Bitcoin added over $10K to its dollar value. If today ends green, there will be seven consecutive green daily candles, as can be seen on the following chart.
Looking at the following short timeframe 4-hour chart, Bitcoin had formed and broken above an inverse head and shoulders pattern, which ignited the past days’ surge. The target for the inverse H&S is around the $60K mark.
Additionally, Bitcoin is now forming a cup & handle pattern. A breakout can be expected around the $57-58K level, however, it would be wise to wait for a confirmation when breaking to a new ATH above $58.5K. In the case of a cup & handle breakout, we could expect the target to be $70K.
BTC Price Support and Resistance Levels to Watch
Key Support Levels: $55,080, $53,980, $52,580, $52,000, $50,168.
Key Resistance Levels: $57,686, $58,355, $59,720, $60,000, $60,735.
Looking ahead, the first level of resistance lies at $57,686 (1.272 Fib Extension, yesterday’s high). This is followed by $58,355 (ATH), $59,720 (short term 1.272 Fib Extension – green), $60,000, and $60,735 (short term 1.414 Fib Extension – green, and the target price for the inverse head & shoulders pattern).
On the other side, the first level of support lies at $55,080 (previous resistance). This is followed by $53,980 (.236 Fib), $52,580 (early March resistance), $52,000, and $50,168 (.5 Fib).
The daily RSI is now approaching overbought conditions but still has room before becoming extremely overbought, indicating the bull run has enough momentum to break the ATH price.
Bitstamp BTC/USD Daily Chart
Bitstamp BTC/USD 4-Hour Chart