Bitcoin Price Analysis: BTC Explodes $6500 Since Tuesday, $60K Breakout Soon?
Bitcoin is up by a strong 7.5% today as the cryptocurrency grinds back toward the $60,000 level, this becomes even more impressive as Wall Street indices are down 1-2%. Decoupling? so far, so good.
Quick recap: BTC had reached a new ATH over the weekend as it hit $61,780 (Bitstamp) on Saturday. From there, it rolled over during the start of this week, whereas on Tuesday it hit the current weekly low at $53220. There, support was found upon an ascending trend line that started forming on February’s last day.
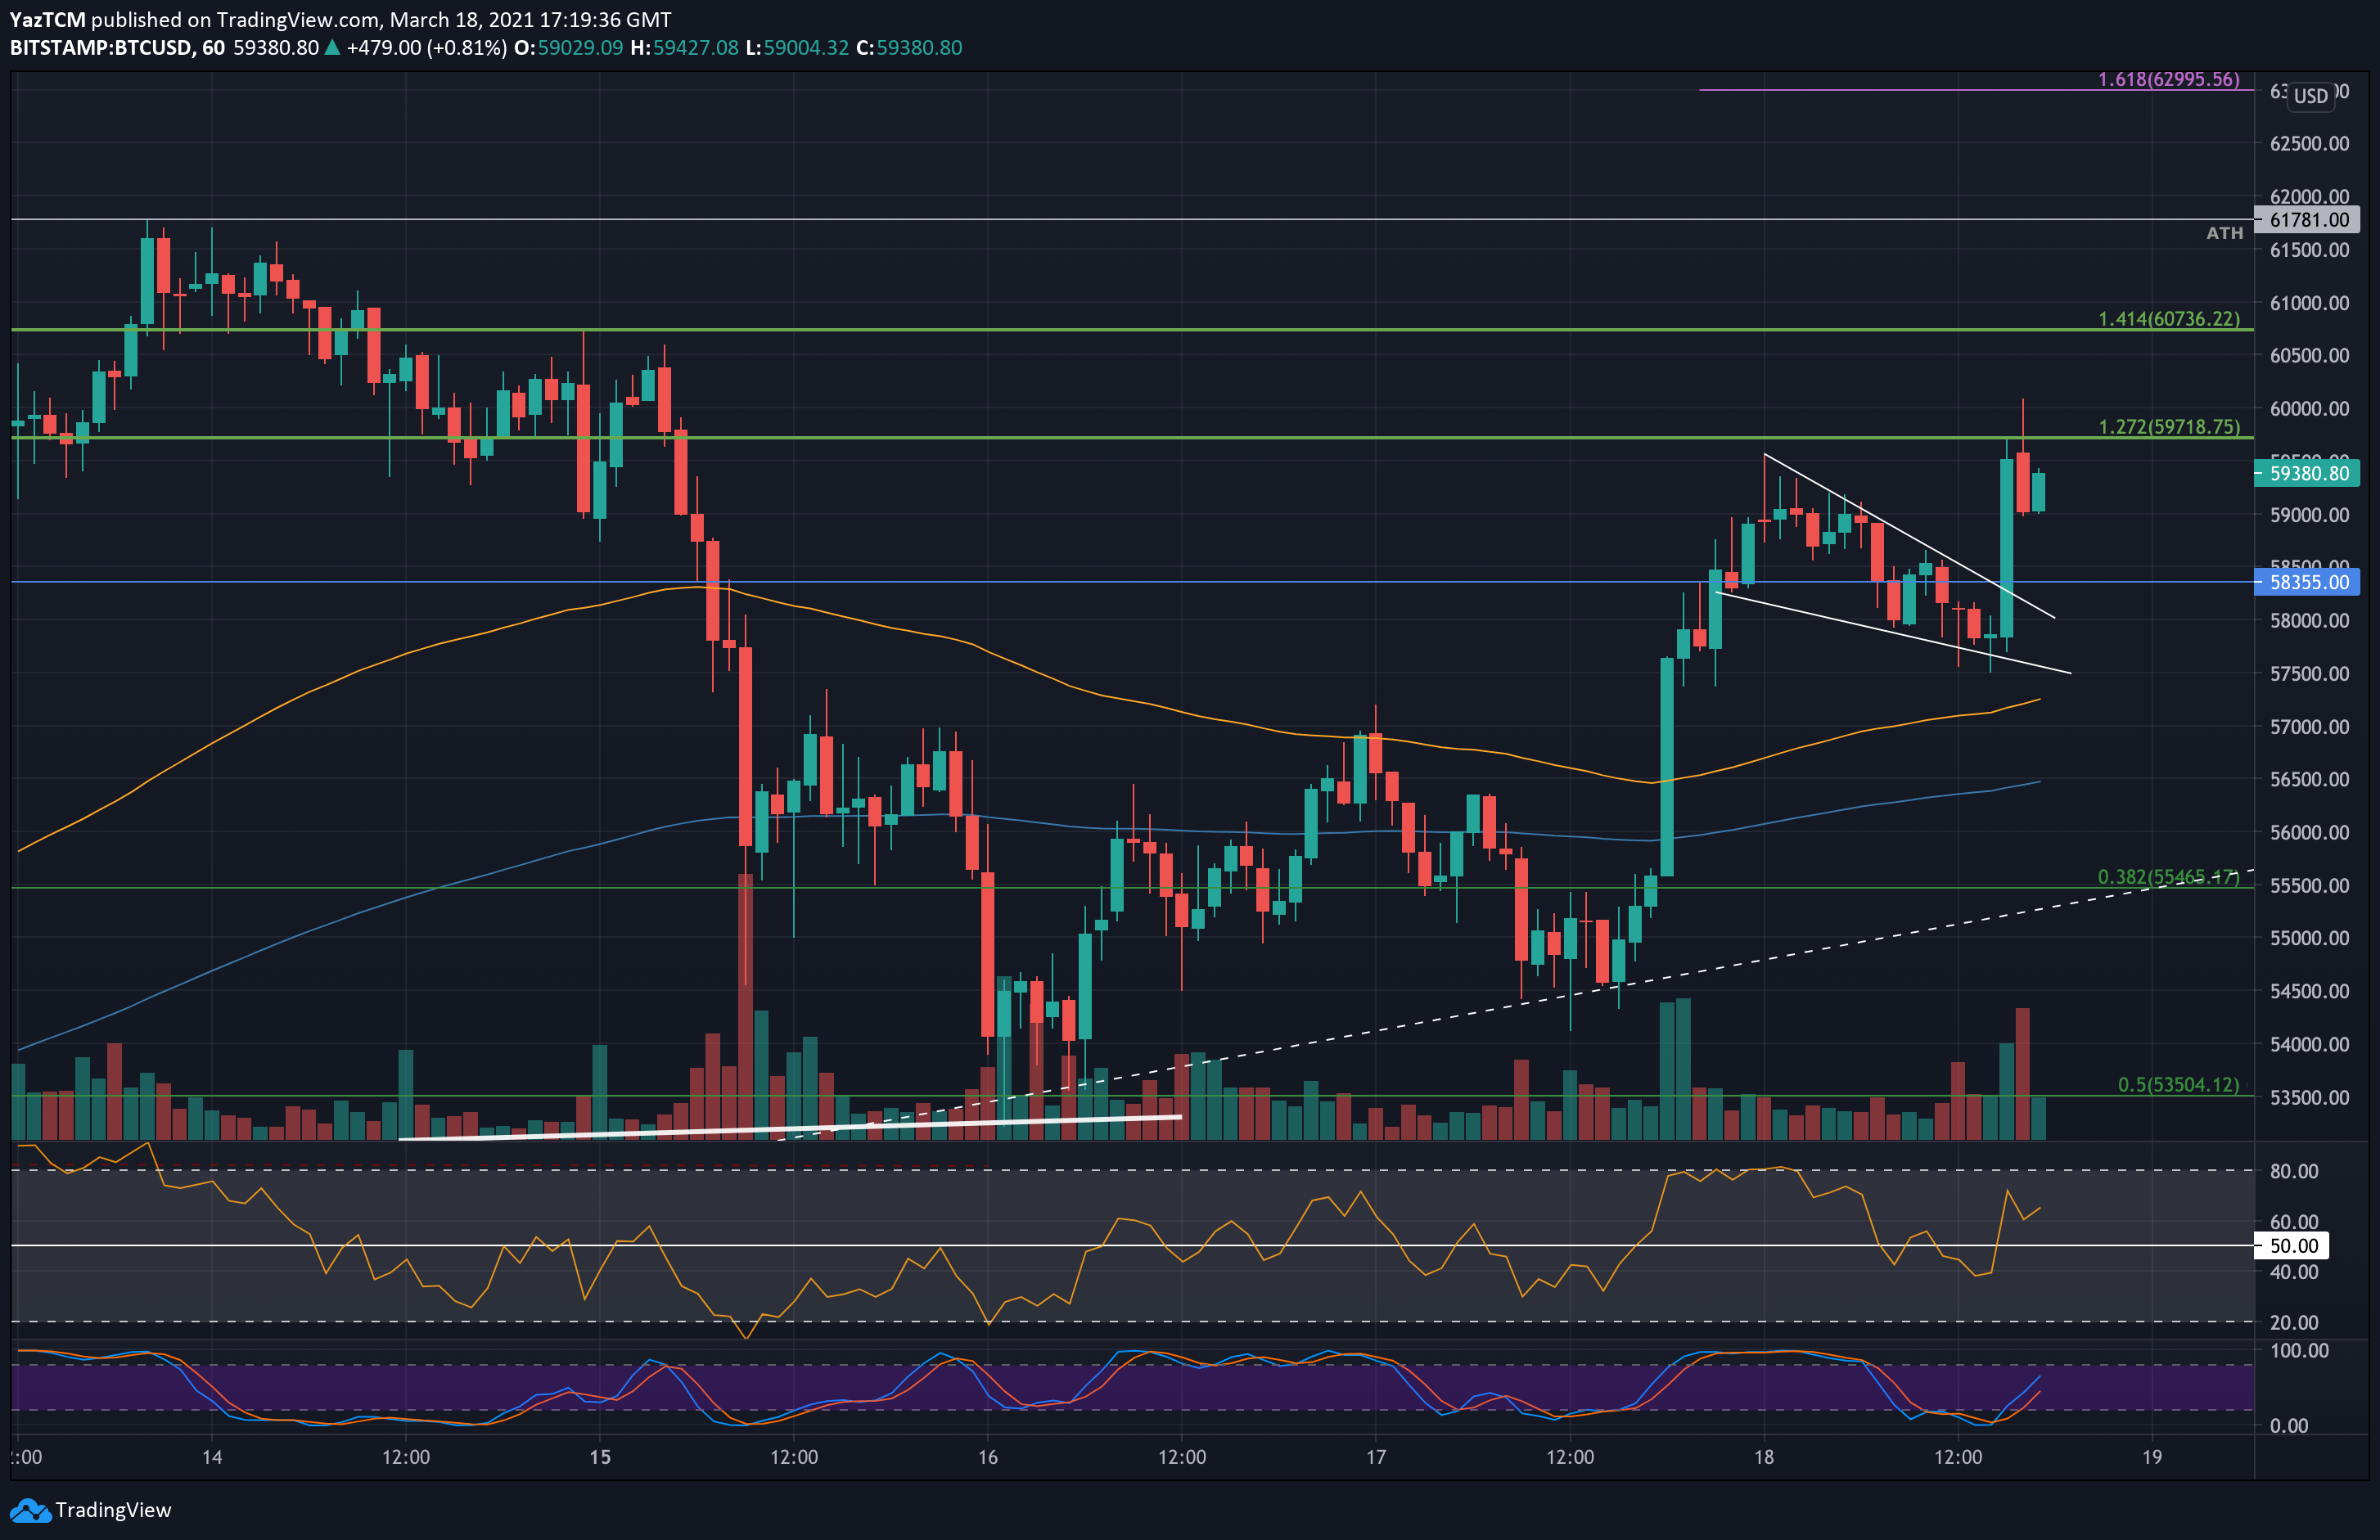
Looking at the short-term timeframe, over the past 24 hours Bitcoin was forming a falling wedge, as can be seen on the 1-hour chart below. The wedge pattern broke to the bullish side just shortly before writing this update.
Following the breakout, Bitcoin soared towards the $60k benchmark, recording $60,083 as the current daily high as of now, according to Bitstamp. Once the wedge was broken, the target is somewhere around the $61,200 area (the pole’s size).
BTC Price Support and Resistance Levels to Watch
Key Support Levels: $58,355, $57,500, $55,465, $53,500, $52,500.
Key Resistance Levels: $59,720 – $60,000, $60,735, $61,200, $61,781 (ATH).
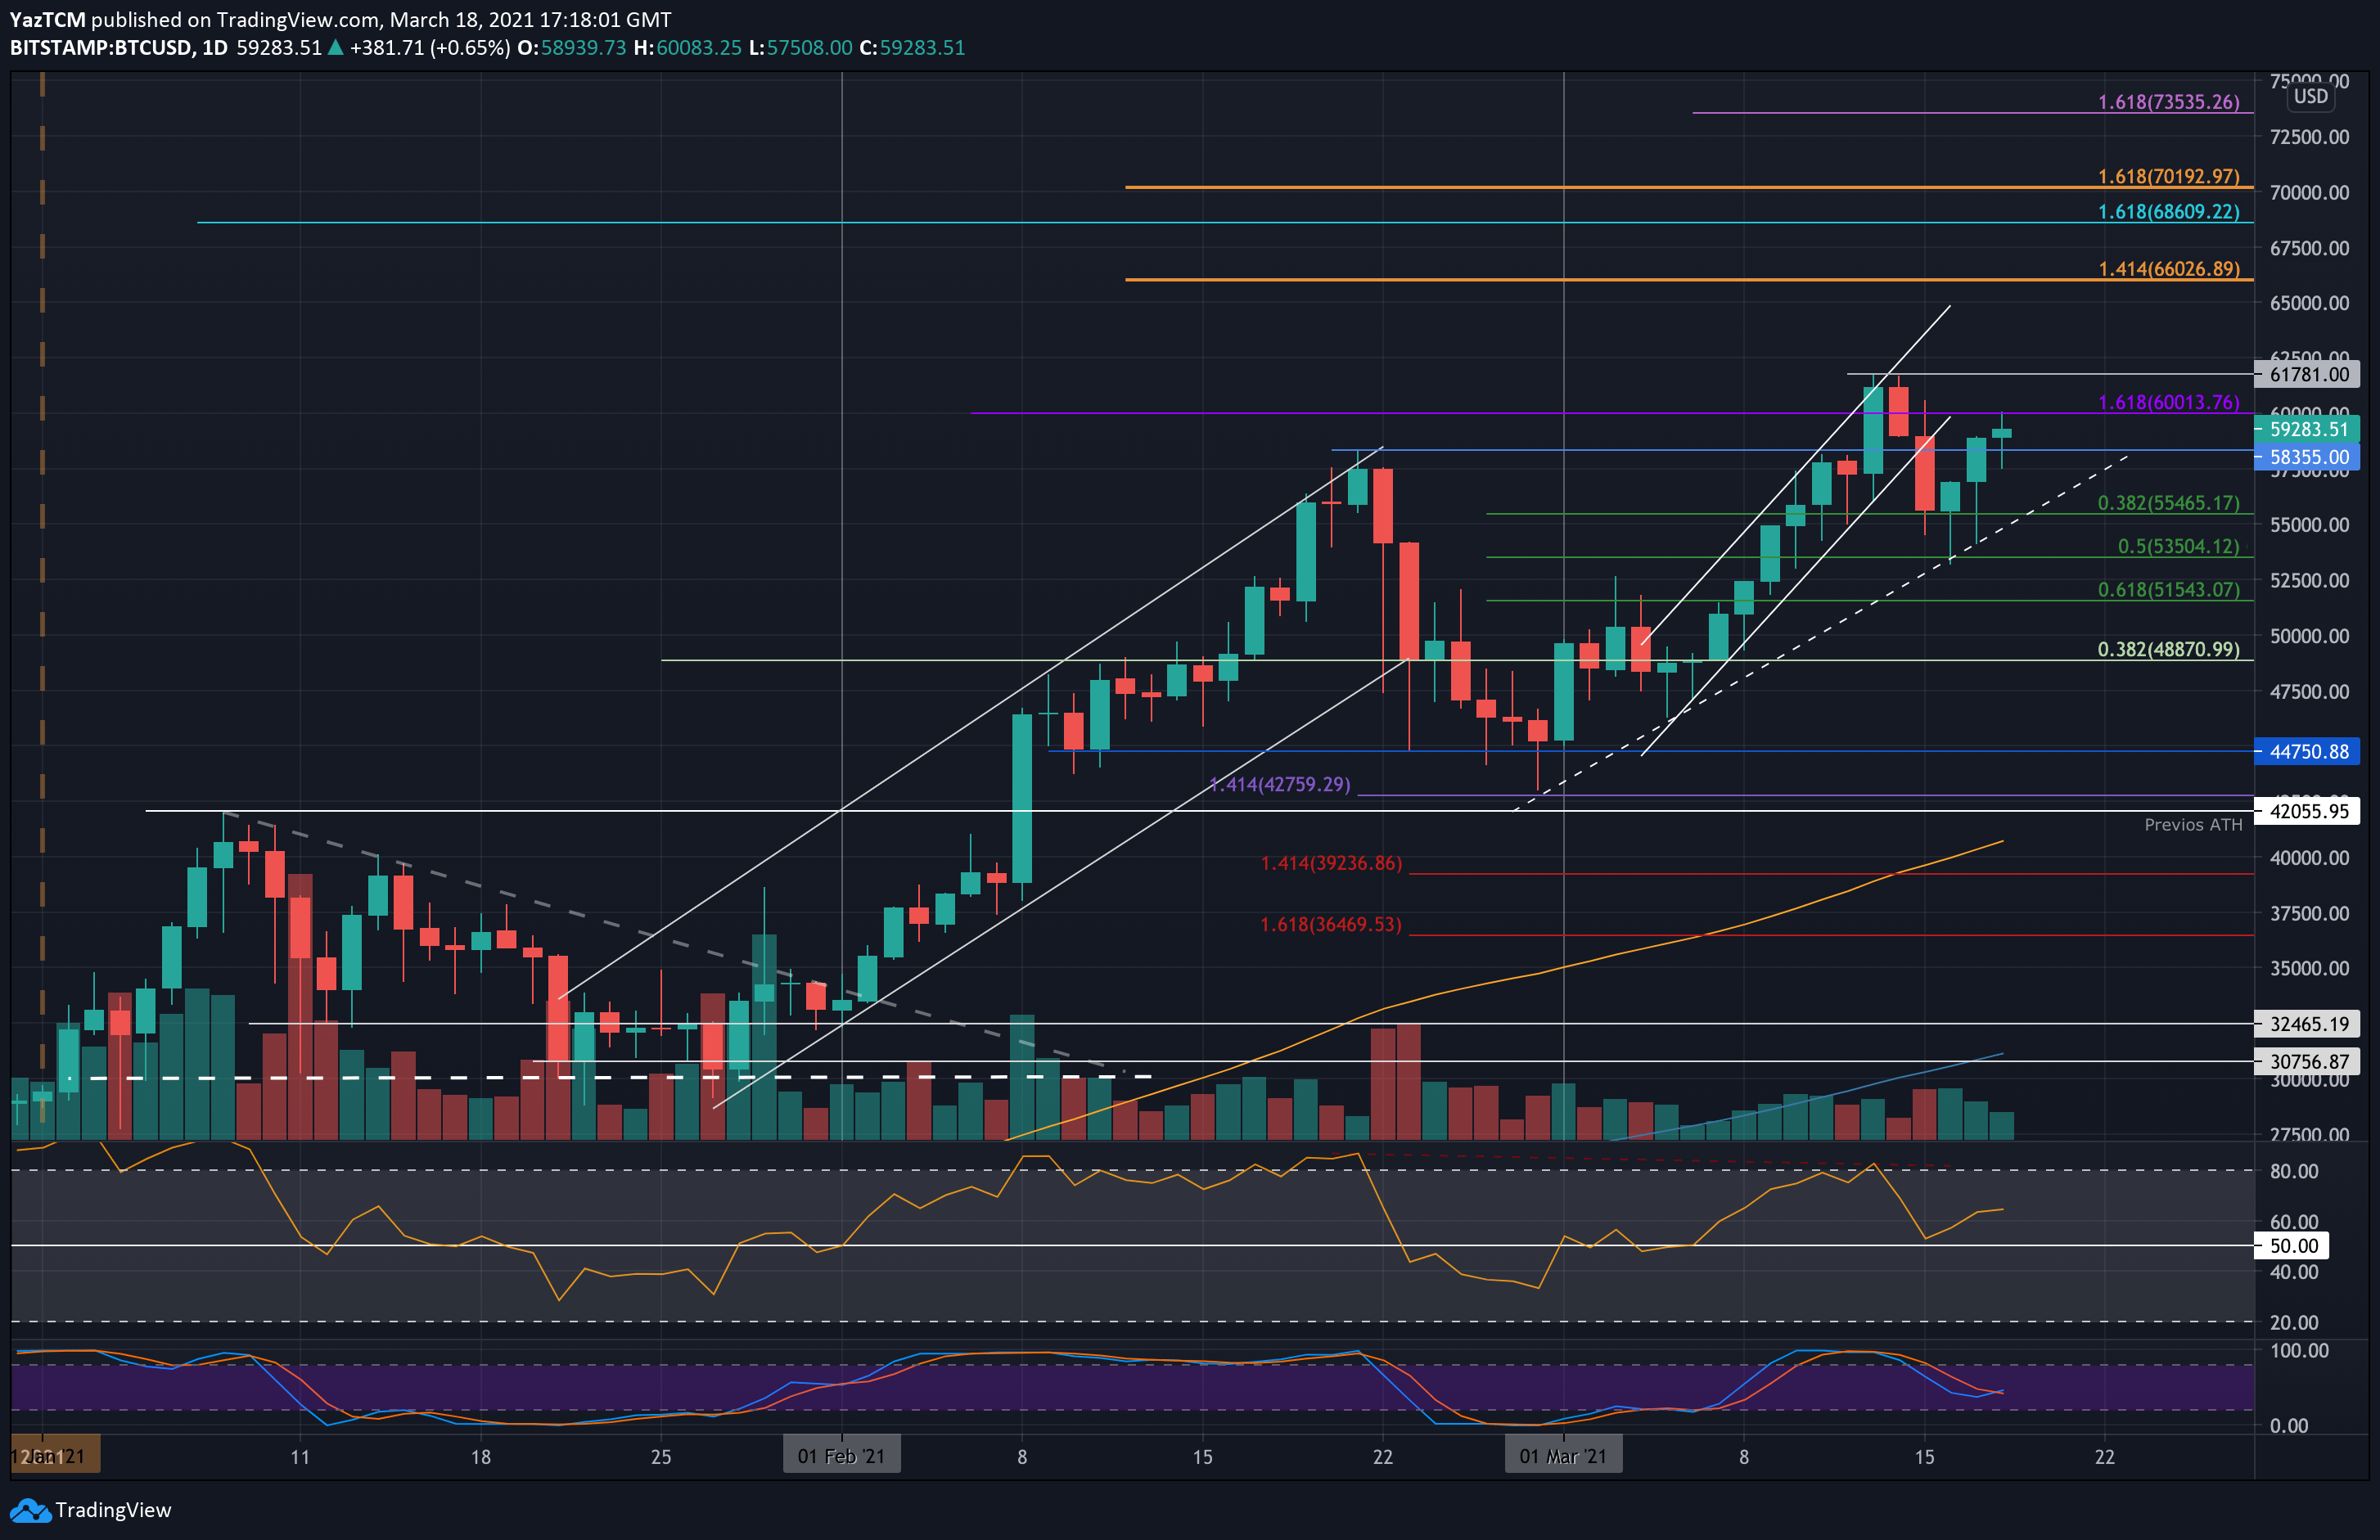
Looking ahead, the first level of resistance lies at $59,720 (short term 1.272 Fib Extension). This is closely followed by $60,000. Beyond $60,000, resistance lies at $60,735 (short term 1.414 Fib Extension), $61.2K, $61,780 (ATH), and $63,000.
On the other side, the first level of support lies at $58,355 (previous ATH). This is followed by $57,500, $55,465 (.382 Fib), the rising trend line, and $53,500 (.5 Fib). Added support lies at $52,500, $51,540 (.618 Fib), and $50,000.
The daily RSI is above the midline and is rising above 60. This indicates that the bullish momentum is picking up within the market.
Bitstamp BTC/USD Daily Chart
Bitstamp BTC/USD 1-Hour Chart