Bitcoin Price Analysis: BTC Dumps 6% As Wall Street Turns Red, Some Worrying Signs Pop
Bitcoin price dropped by over 6% today, losing over $5K from its value since the high reached just yesterday at $52,500.
Quick recap: BTC had found solid support at the $43K – $44K area during the start of the week following a sharp decline from the ATH level of $58,000 reached just the week before. Bitcoin had penetrated beneath the lower boundary of an ascending price channel during that drop, showing the first sign of weakness as the bullish month of February 2021 ended.
At the beginning of March, following a consolidation inside a falling wedge pattern, Bitcoin did manage to break to the upper side, and we saw a wild move until reaching $52.5K as of yesterday. From there Bitcoin retraced.
Worrying Signs For The Short-Term
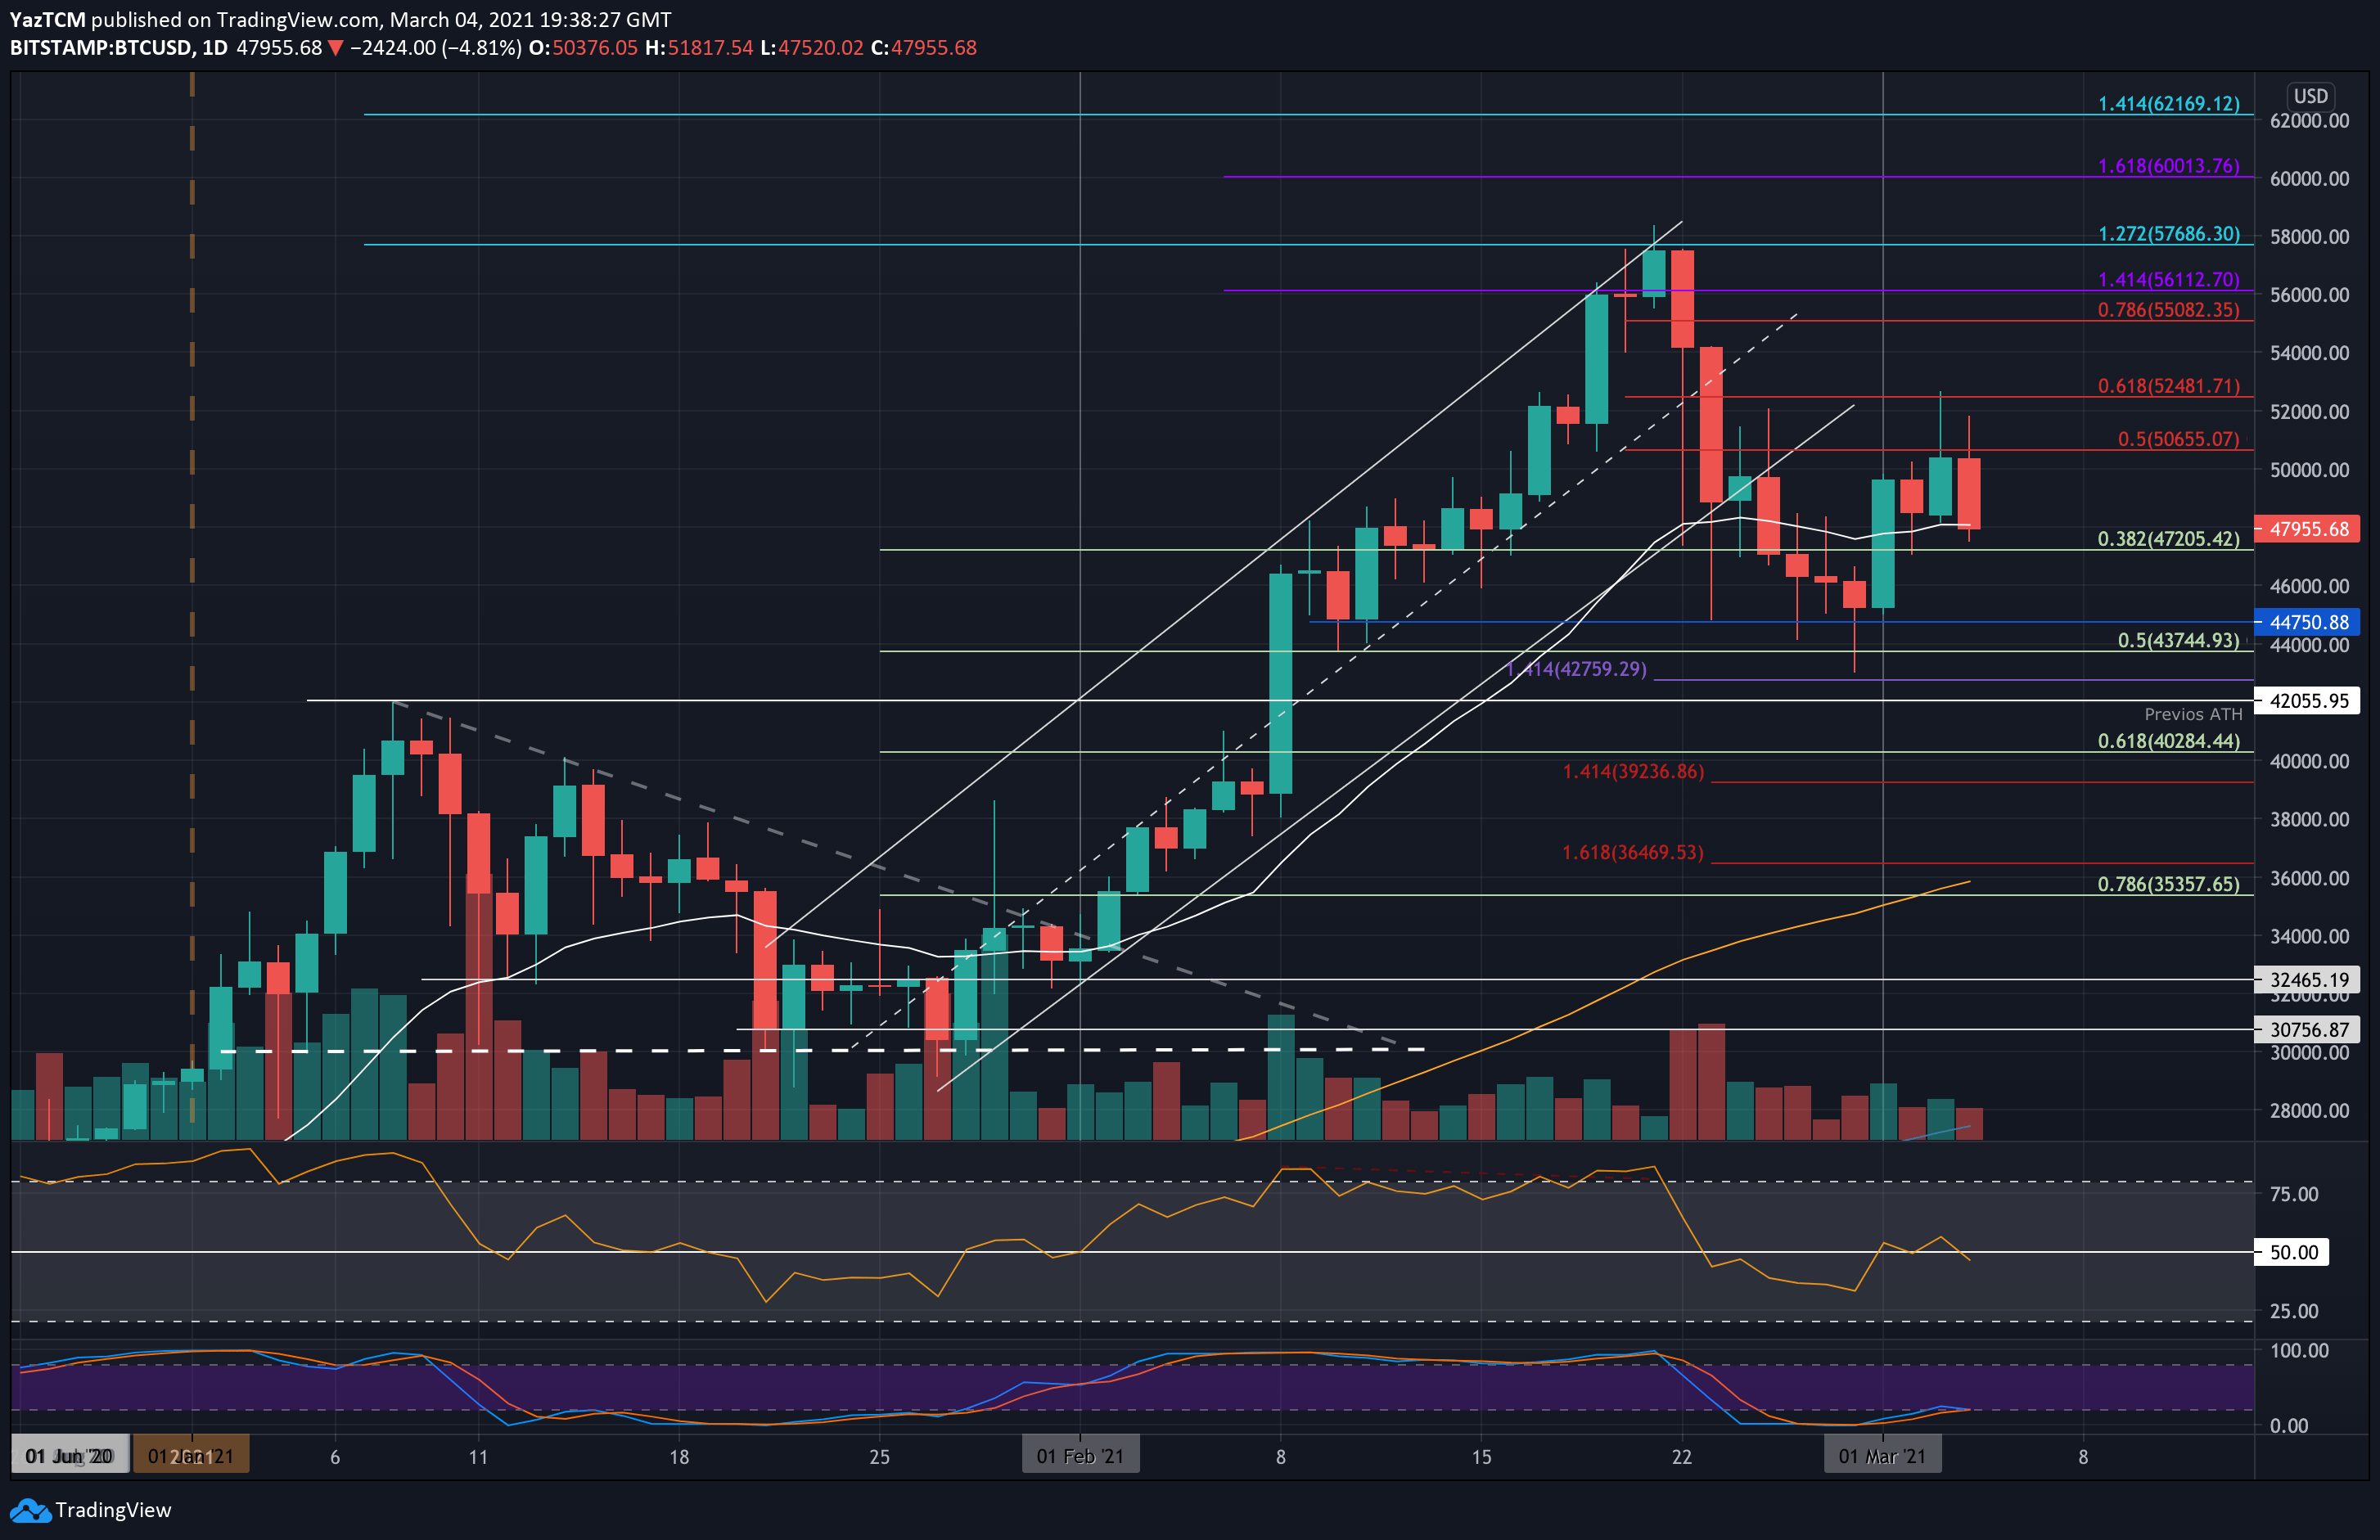
The $52.5K is also the Golden Fibonacci retracement level (61.8%), of the bearish move measured from the ATH level down to last week’s low at $43K. This means that technically, for the short-term, Bitcoin is now bearish.
We had mentioned here today another concern for Bitcoin: the correlation to Wall Street reached a 5-month high. Today, following a disappointing speech by Powell, the S&P 500 and Nasdaq responded with heavy declines of 2-3%. Bitcoin, just like an educated soldier, followed the move and is declining sharply as of writing these lines.
BTC Price Support and Resistance Levels to Watch
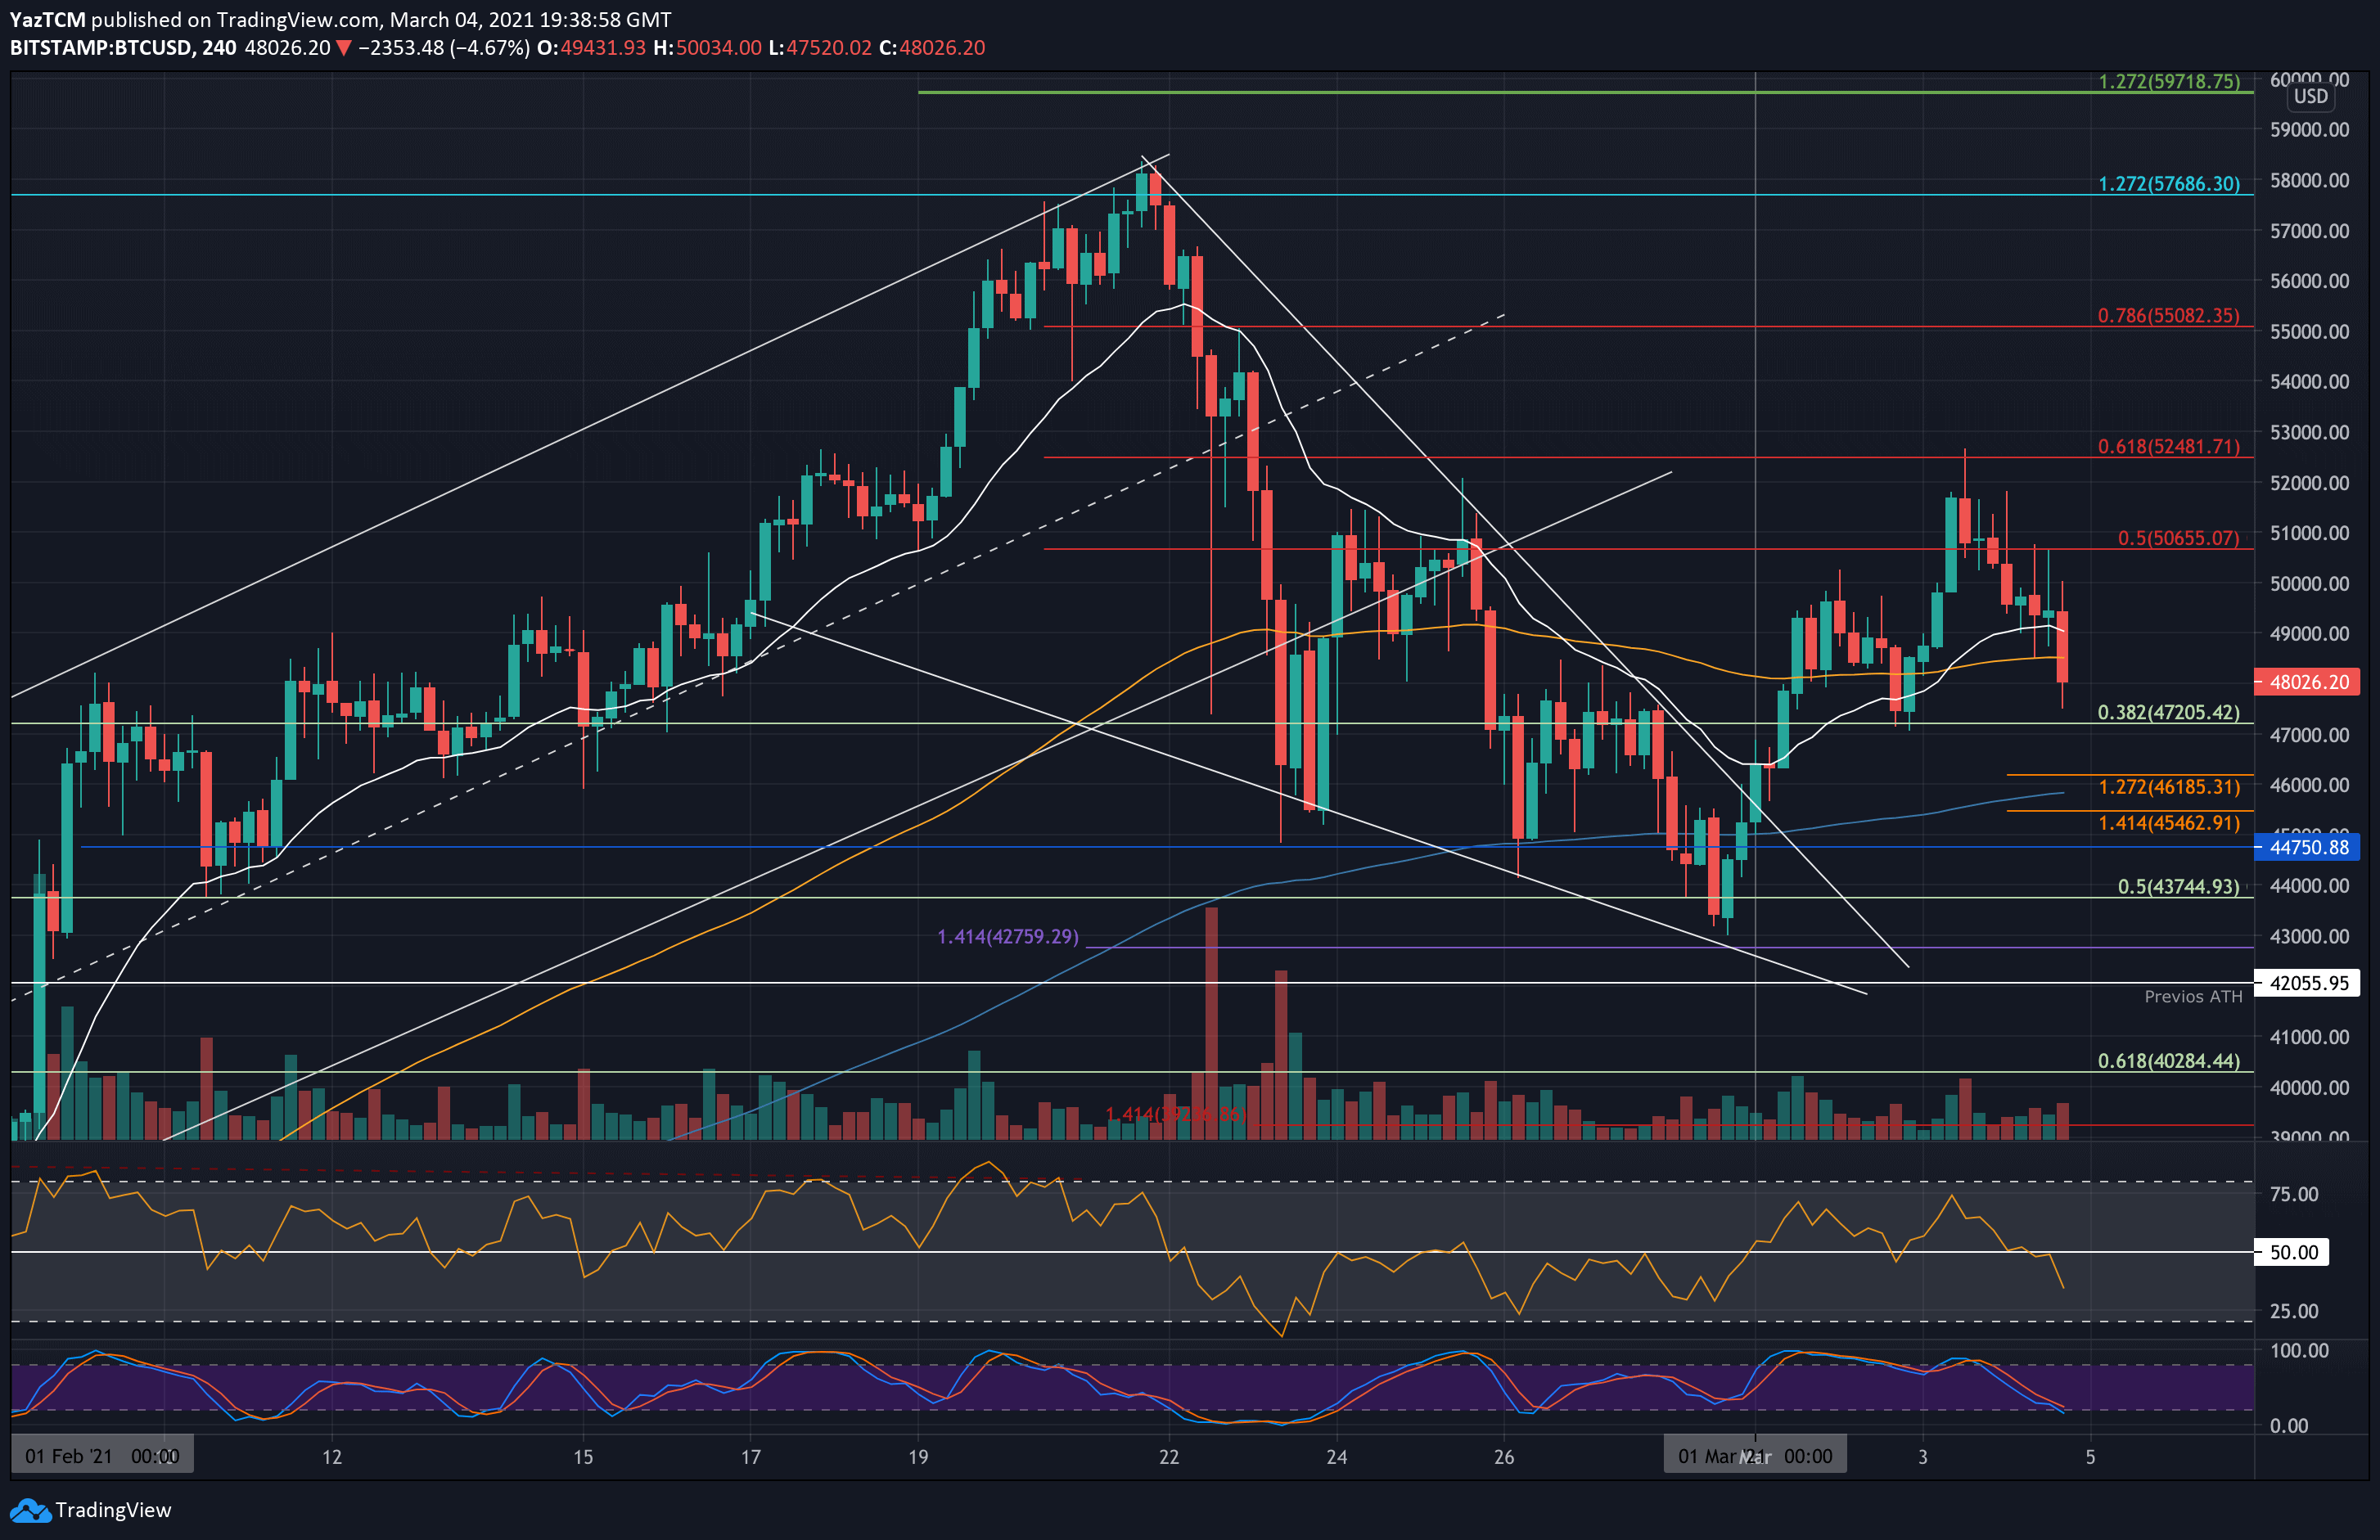
Key Support Levels: $48,000, $47,200, $46,000, $44,750, $43,756.
Key Resistance Levels: $50,000, $50,655, $52,000, $52,500, $54,000.
Looking ahead, if the sellers break beneath the 20-days EMA and push below $48,000, the first level of support lies at $47,200 (.382 Fib). This is followed by $46,000, $44,750, $43,756 (.5 Fib, and last week’s low), and $42,760 (downside 1.414 Fib Extension).
On the other side, the first level of resistance lies at $50,000 once again. This is followed by $50,655 (bearish .5 Fib), $52,000, and $52,500 (bearish .618 Fib, and this week’s high). Additional resistance lies at $54,000 and $55,080 (bearish .786 Fib).
The daily RSI is now poking beneath the midline again, indicating the bears are attempting to take control of the market momentum. If it continues beneath 50, the bearish momentum will increase and drive the price of Bitcoin lower.
Bitstamp BTC/USD Daily Chart
Bitstamp BTC/USD 4-Hour Chart