Bitcoin Price Analysis: BTC Dips, This is the Key Level to Watch
All markets are having a hard time during Monday’s trading session and Bitcoin is no exception. The cryptocurrency is down just shy of 2 percent in the past 24 hours while altcoins are mostly in red.
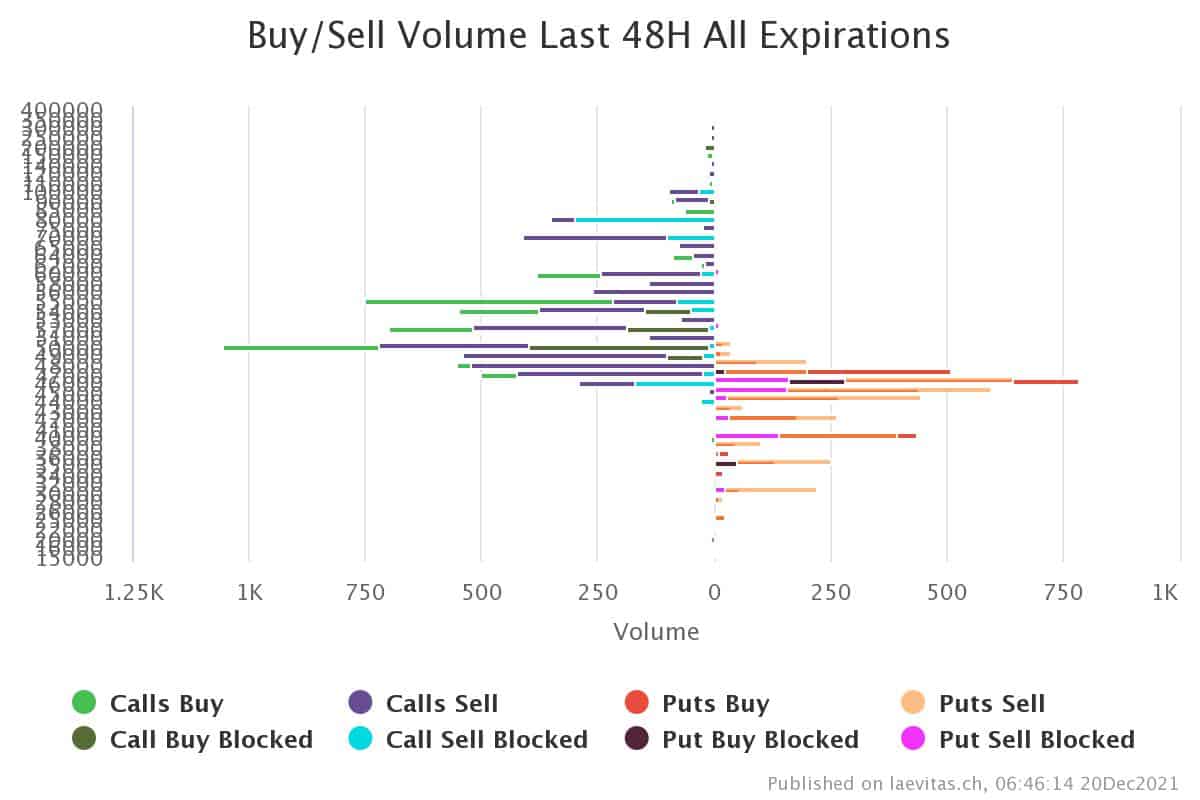
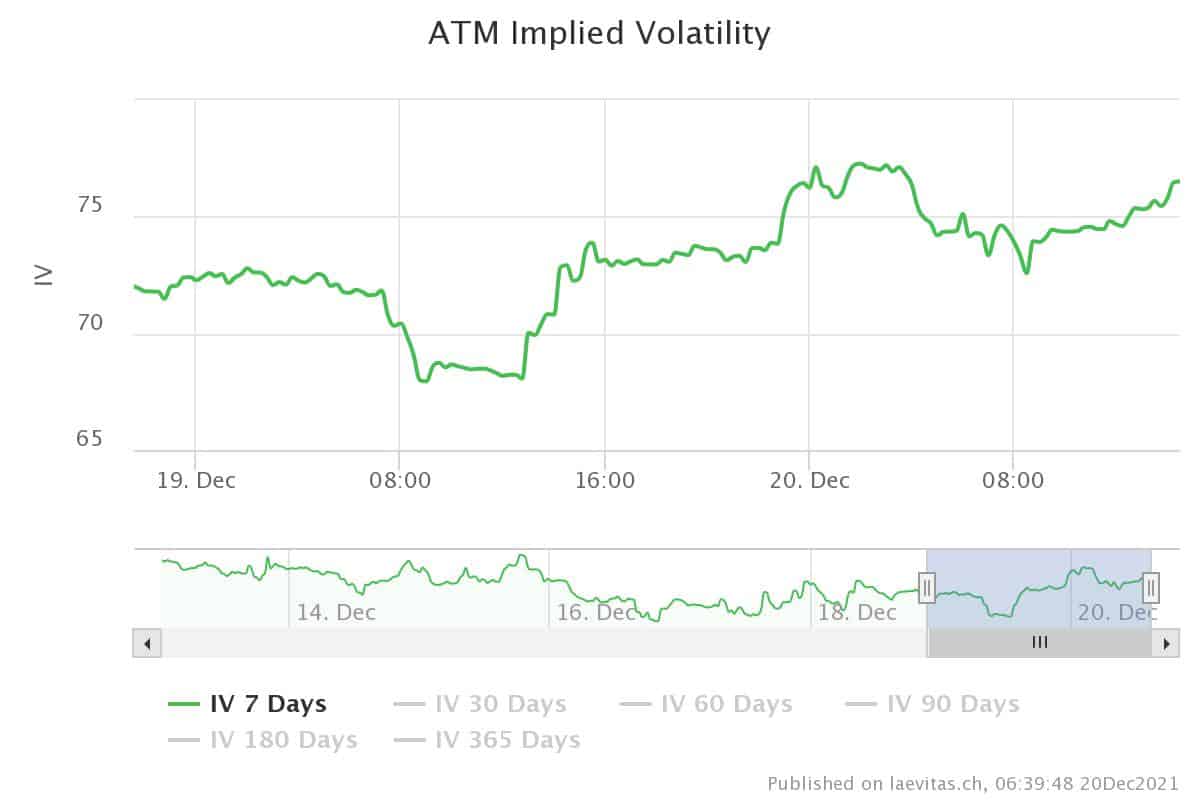
Option Market Analysis
The rising cases of the highly transmissible Omicron caused fear in all markets. Investors are worried about lockdowns which may have negative effects on the economy. In the options market, Short-dated implied volatility also increased accordingly to fear.
Bitcoin dipped below $46k. Traders hedged their portfolios by selling calls and buying puts. Over the previous two days, options traders bought calls for $50k, $55k & $60k strikes for the following year’s expiries. It seems that they are still optimistic about the upcoming months.
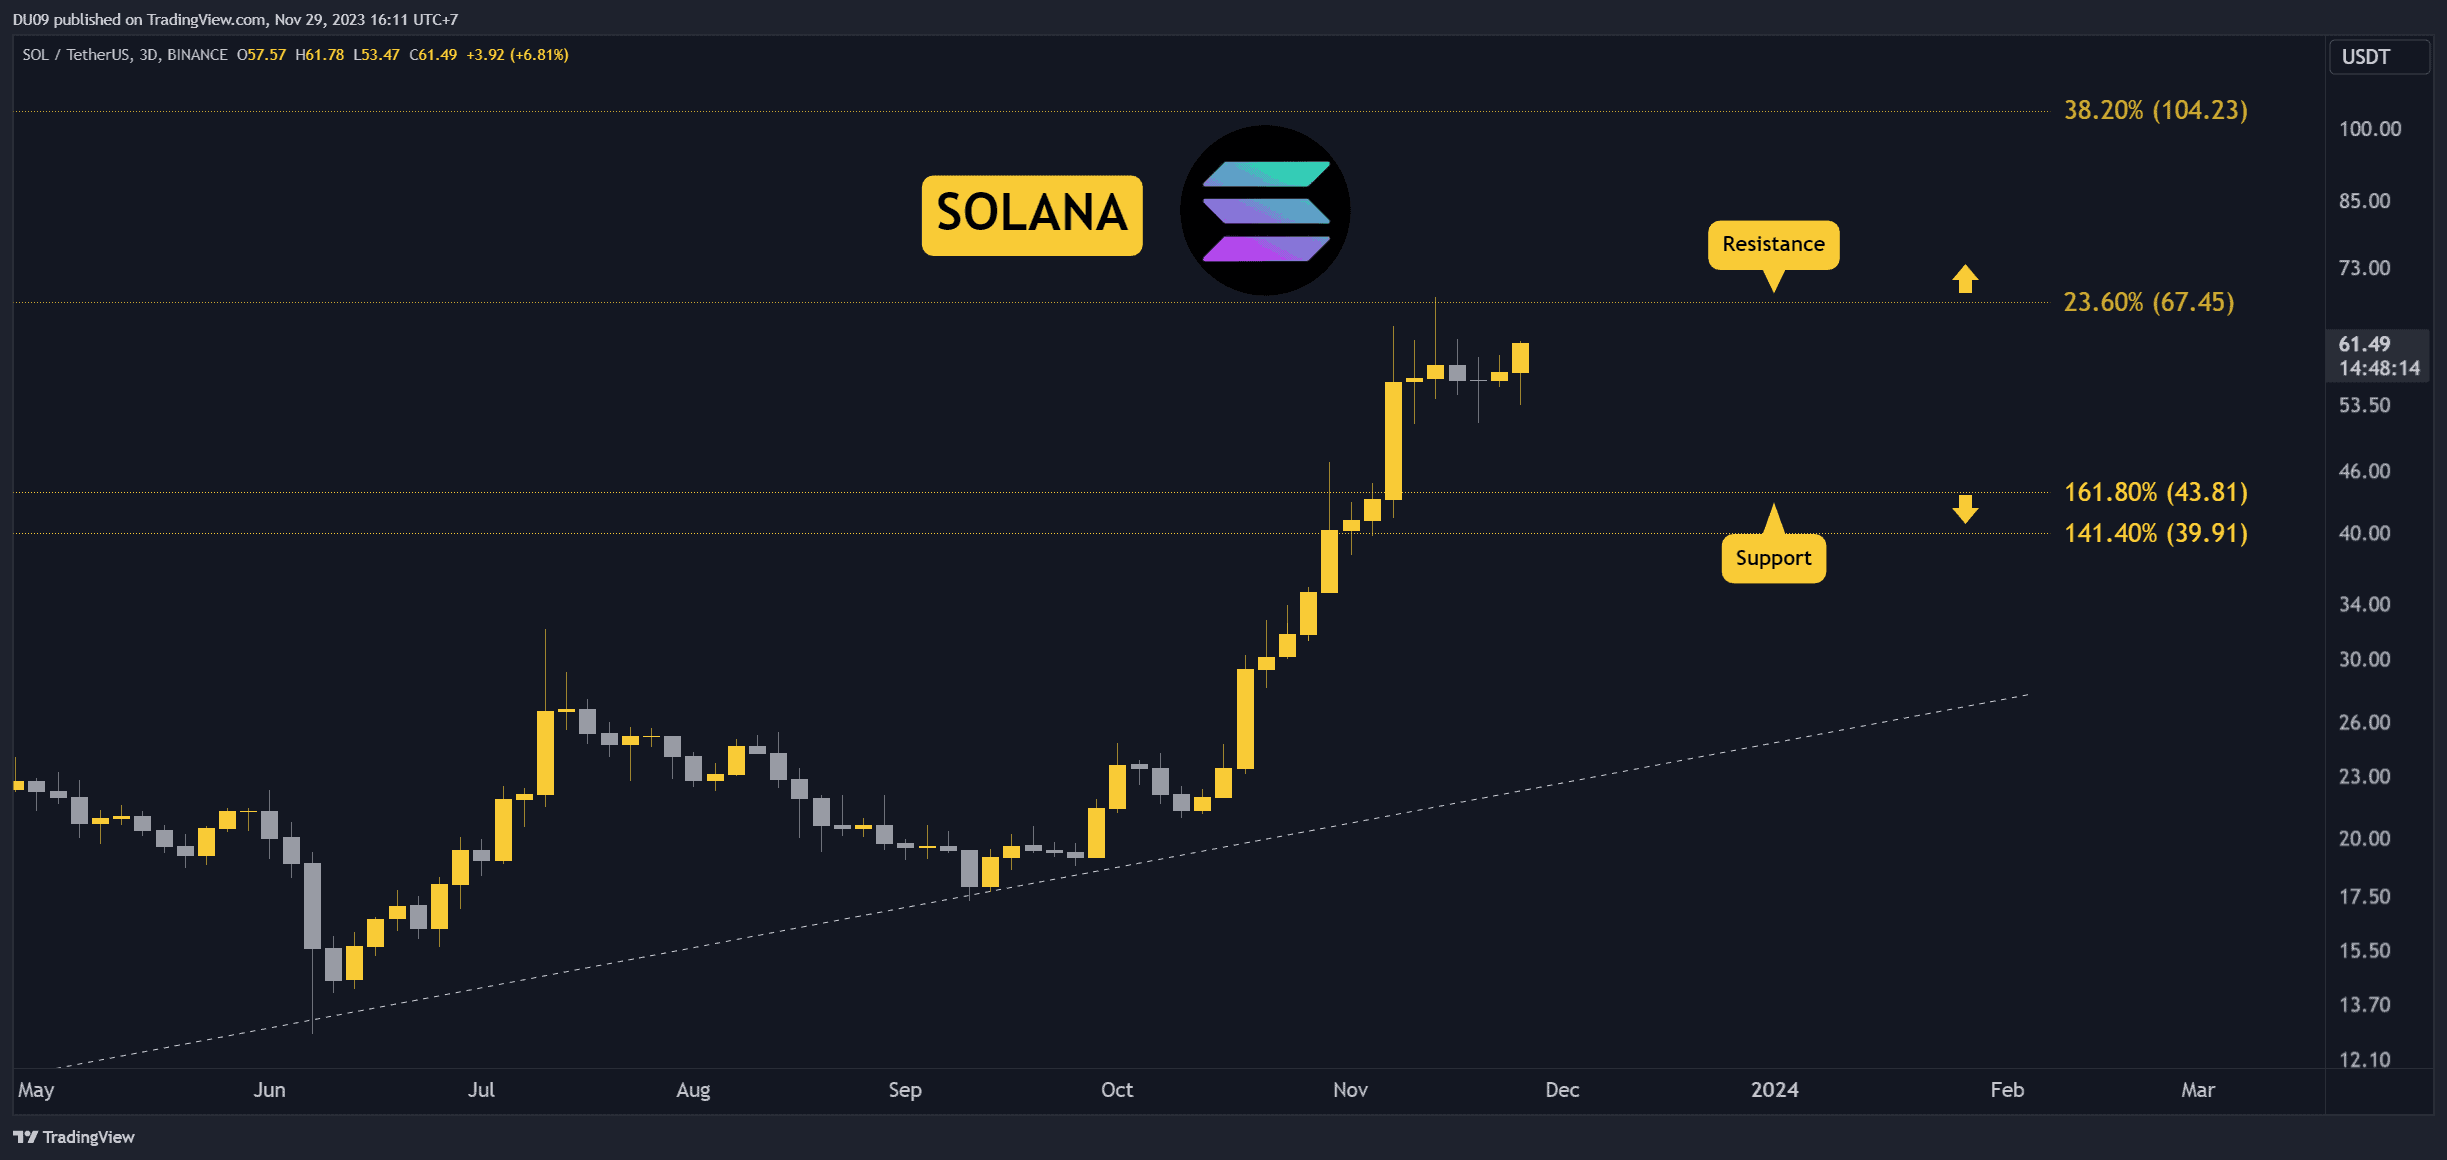
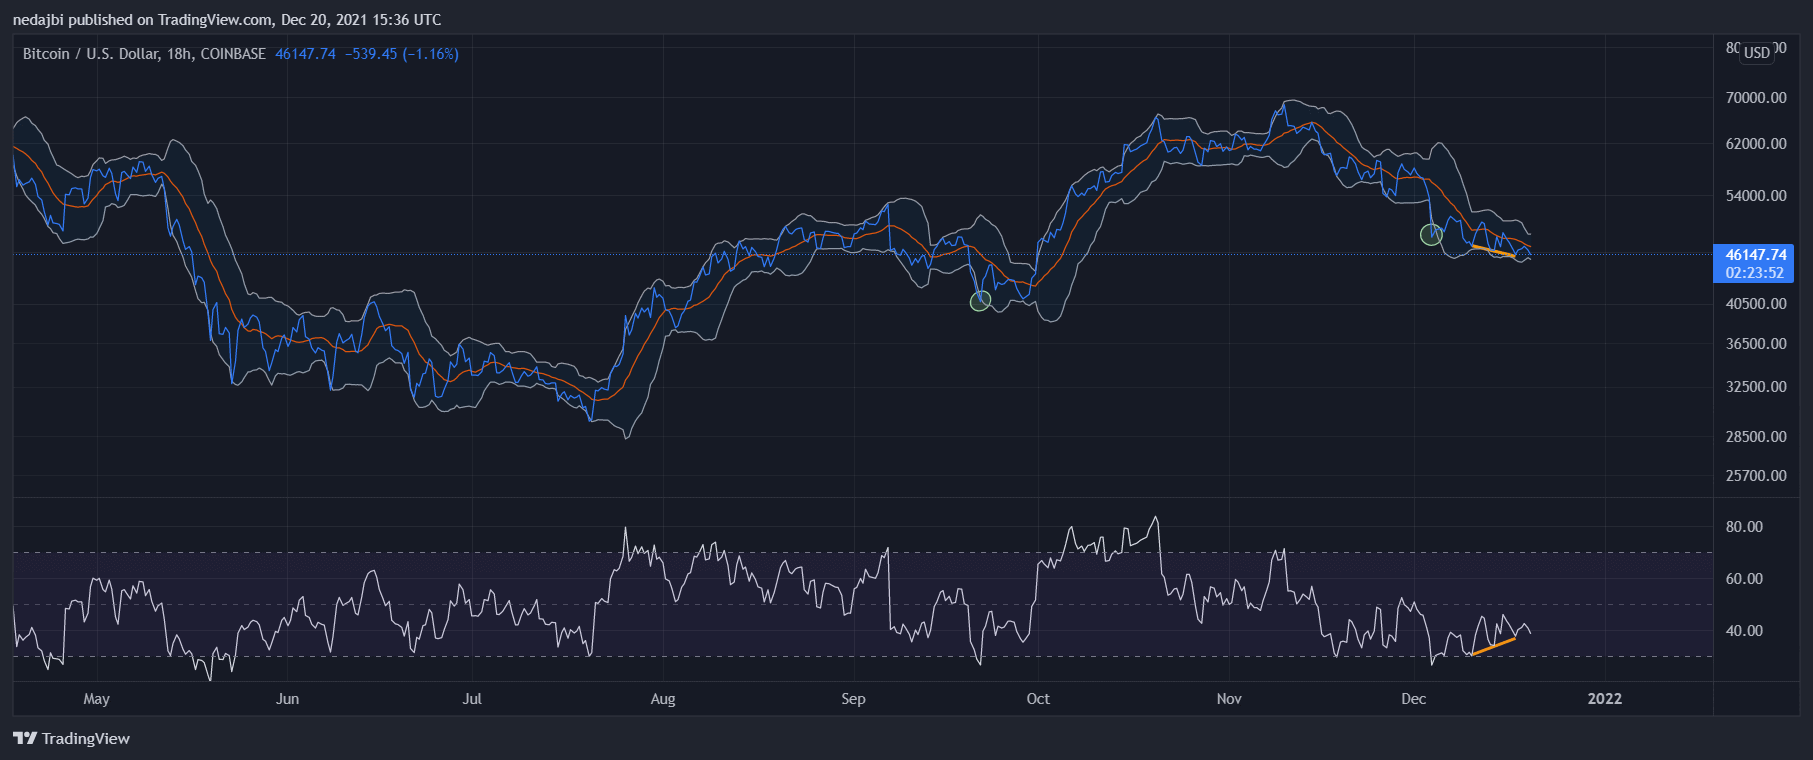
Technical Analysis (short-term)
After testing the lower Bollinger band on an 18-hour time frame, it seems the price might react to this formed support level. A Bollinger band squeeze can be seen in lower time frames. Therefore, a bullish divergence is forming on the 18-hour chart but is not confirmed yet. It will be confirmed by closing a candle above $49k.
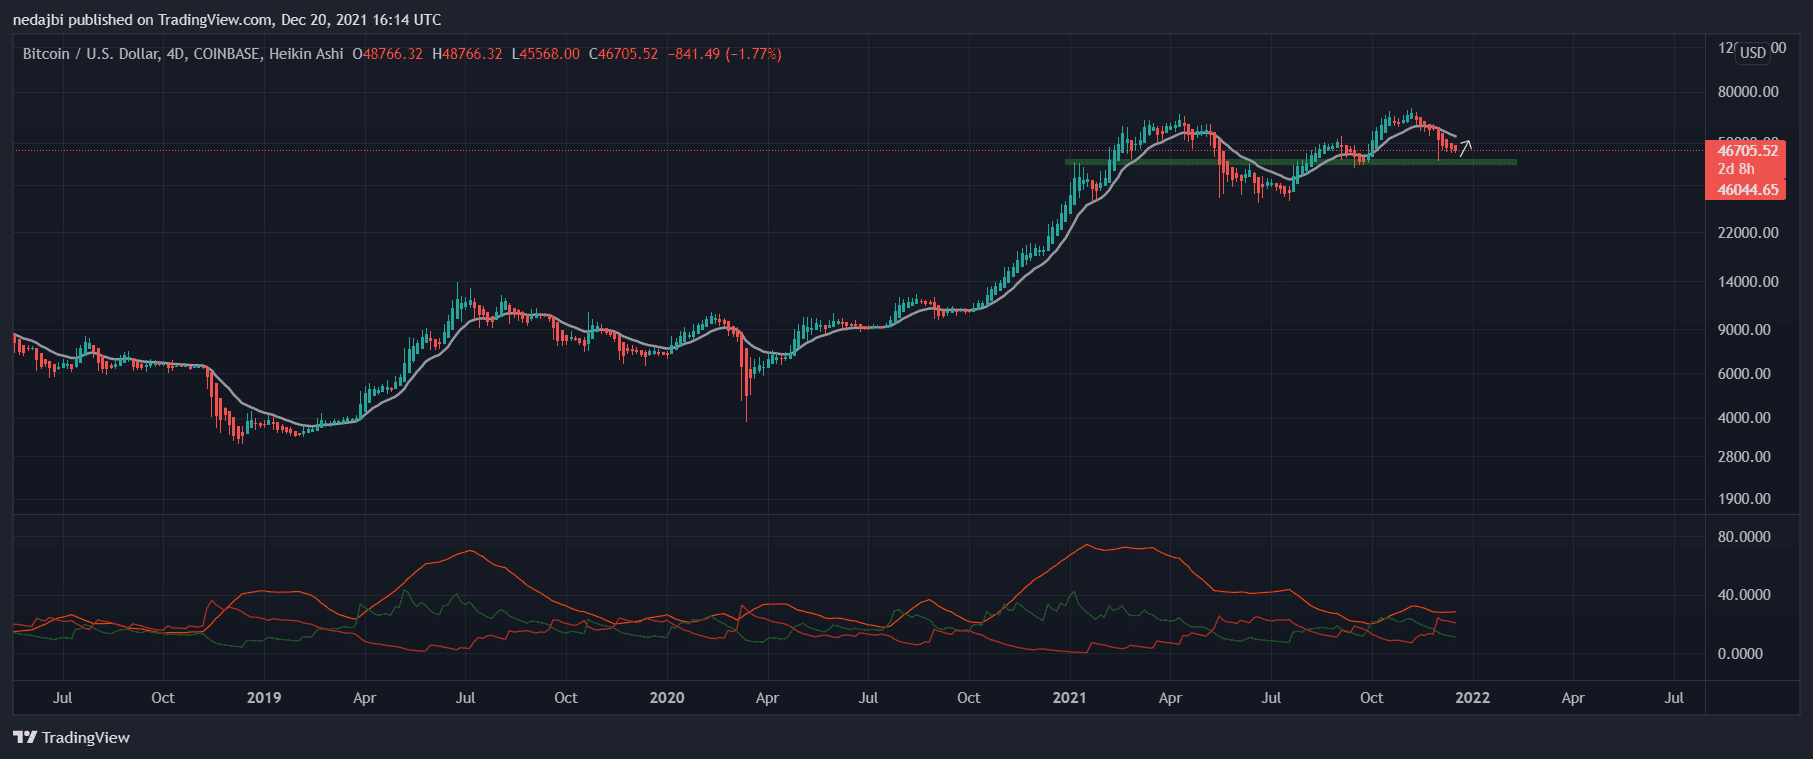
Technical Analysis (long-term)
14 EMA on 4D Heiken-Ashi has been a good support level for Bitcoin in the long term. The directional movement index (DMI) can underline the strength and direction of a price movement. Bitcoin is below this EMA since breaking it down. Also –DI>+DI, but ADX value suggests a weak trend. In the following days, a pull-back to the EMA can be expected.
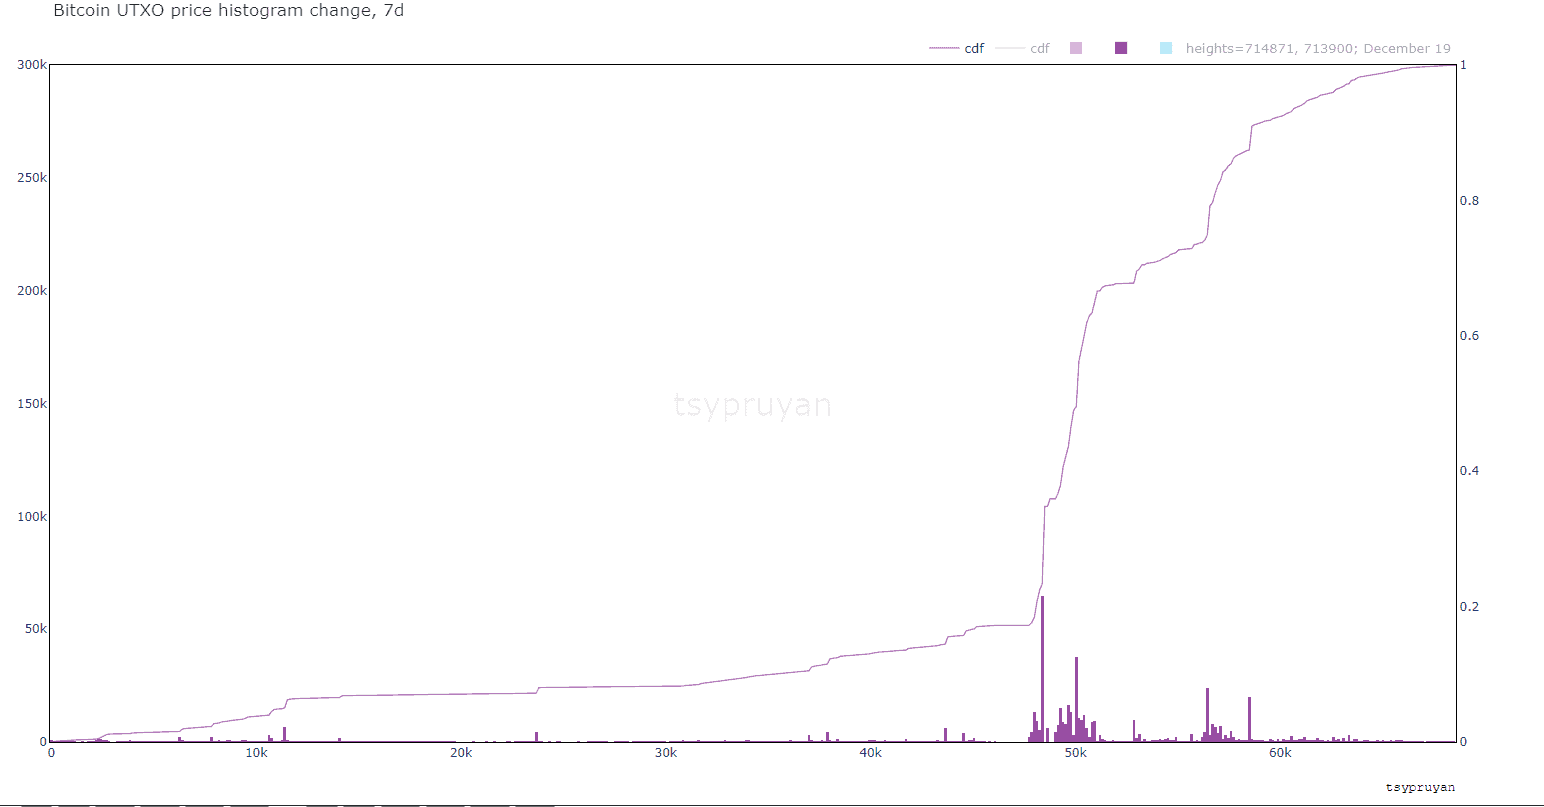
Onchain Analysis
Interestingly, the main sell-pressure (~83%) in the last 7D were the coins last moved (bought) at >$45K Purple square aka “Top Buyers.”
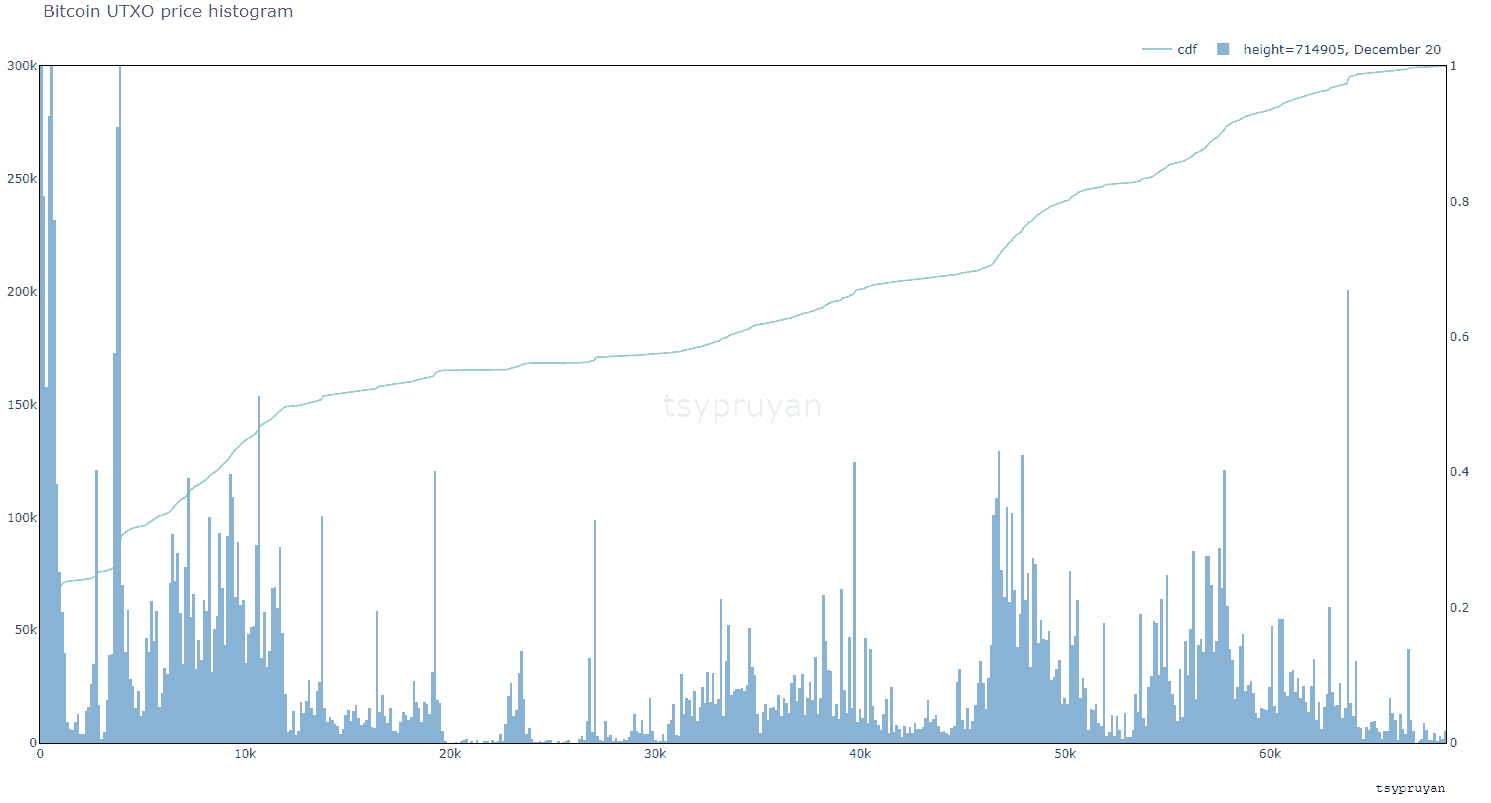
These top buyers almost have 31% of the supply in their possession (blue square). This means we have not seen significant selling pressure from old coin holders.
The above analysis was complied by @N__E__D__A, and @CryptoVizArt. Data provided by @tsypruyan exclusively for CryptoPotato.