Bitcoin Price Analysis: BTC Calms Down, Does The Weekend Predict Another Volatile Move Ahead?
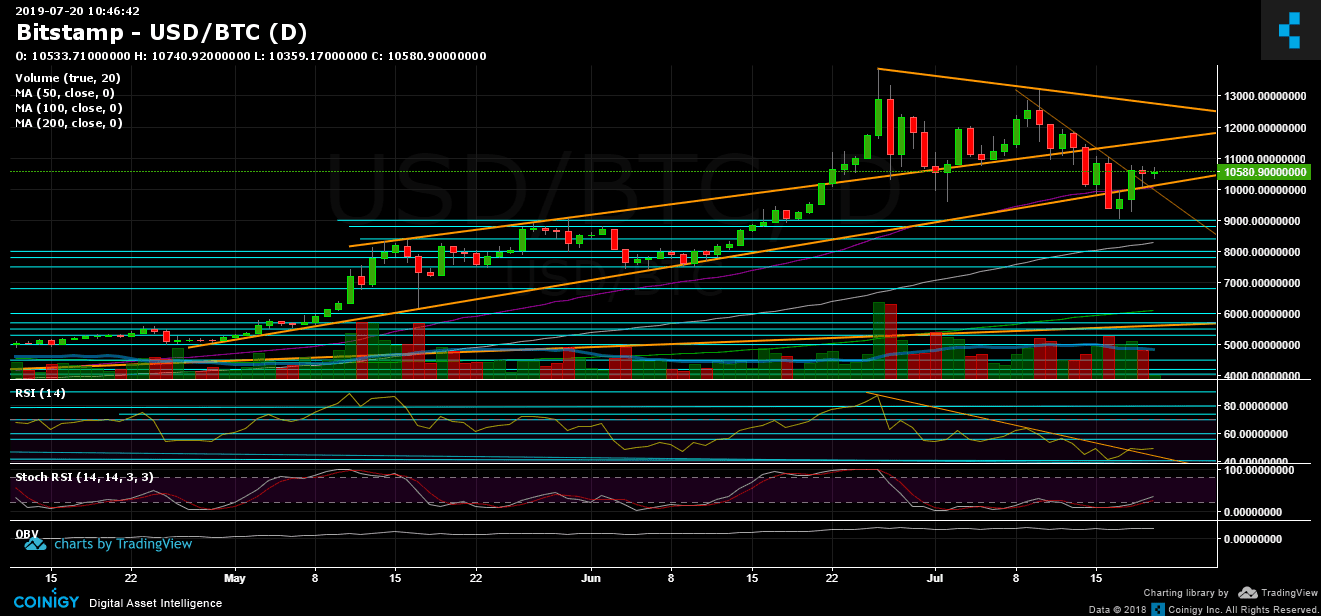
The Bitcoin volatility continues. Over the past week, since Bitcoin had lost the significant $11,200 support level along with the upper ascending trend-line (shown on the daily chart), Bitcoin became a volatility machine.
The coin went down to $9,800 (the 50-days moving average line), corrected back up to $11,000, down again to $9000 (the current low since the parabolic bull-run initiated, a new lower low passed down the prior low at $9,600), just to touch $10,000 a few hours after. From there, a stunning 1-day move down to $9,200 and from there, the unbelievable 30-minutes long green candle that reached at last almost the $10,800 resistance level.
Following that, Bitcoin went down to re-test the $10,000 area, but as of writing these words, the coin is trading steadily around the $10,600 resistance mark.
What’s going on here? Is Bitcoin bearish or bullish?
This is a tough question to answer. By looking at the longer-term trend-line, we can see that Bitcoin is indeed very bullish since 2019 began.
Mid-term: In the daily chart (the mid-term), we can see that Bitcoin couldn’t overcome the $11,000 – $11,200 supply zone and until then it will hard to say that the bulls are in control. Add to it the RSI, which is hovering around the 50 levels and moving down in a lower low pattern.
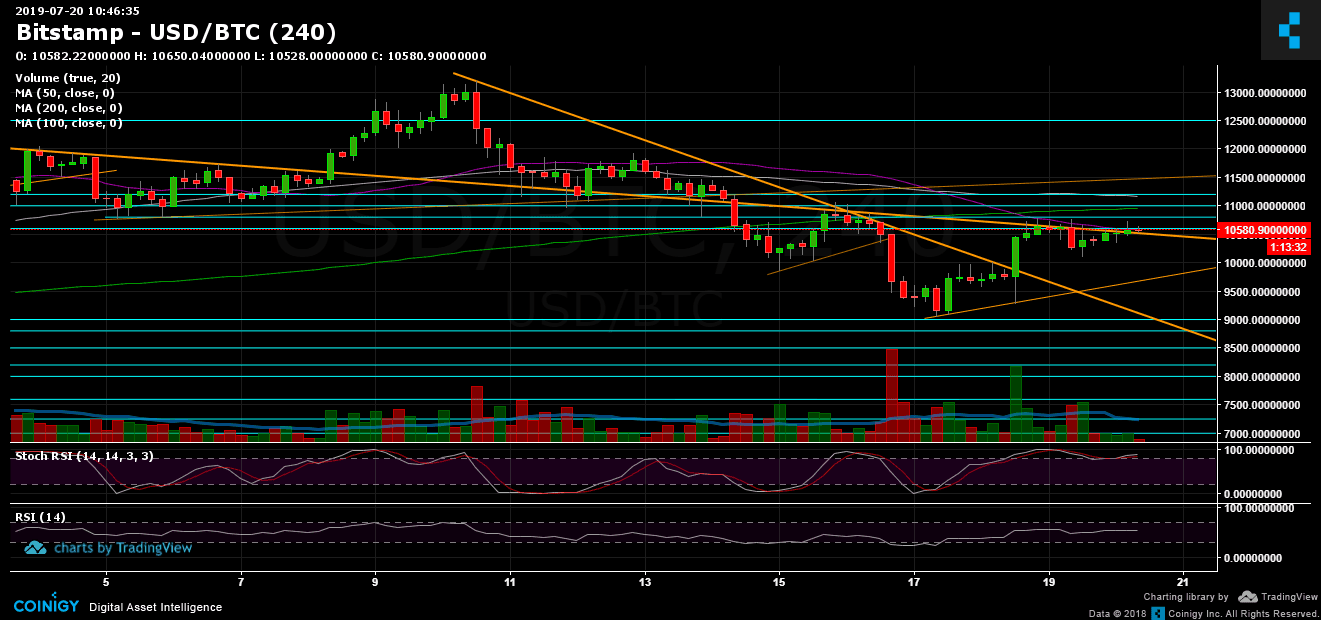
Looking on the 4-hour chart, which is the short-term analysis, we can see Bitcoin producing higher lows, and forming a bullish triangle pattern with a breakout possibility above $10,800 and a possible target of $12,500.
Adding to that, for traders, such market conditions are tough to trade. The direction could change at any moment, with extreme volatility.
Total Market Cap: $288 billion
Bitcoin Market Cap: $188 billion
BTC Dominance Index: 65.4%
*Data by CoinGecko
Key Levels to Watch
– Support/Resistance:
As mentioned above, Bitcoin is now facing resistance at $10,600. Breaking up and the next level lies at $10,800 before reaching $11,000 and $11,200. Further above is the significant mid-term ascending trend line (started forming during May 2019), and the significant area of $11,500 – $11,600. Breaking the last and the next levels are $12,000, $12,200 and $12,500.
From below, the nearest level of support lies at $10,300. Below is the $10,000 region along with the 50-days moving average line (marked in purple). Further below are $9,800, $9,600 and $9,400. Before reaching the past week’s lows at around $9,000 – $9,200.
– Daily chart’s RSI: Discussed above. Stochastic RSI oscillator had recently produced the anticipated cross-over at the oversold area, and now enters the bullish territory, this can be a game-changes bullish indicator for Bitcoin.
– Trading Volume: The past week was followed by huge volatility in both directions. At this moment it’s hard to say which volume candles are larger – the buyers’ or the sellers’.
BTC/USD BitStamp 4-Hour Chart
BTC/USD BitStamp 1-Day Chart
The post Bitcoin Price Analysis: BTC Calms Down, Does The Weekend Predict Another Volatile Move Ahead? appeared first on CryptoPotato.