Bitcoin Price Analysis: BTC Approaches $97K Resistance Amid Emerging Warning Signals
Bitcoin is facing strong resistance at the $97K level, highlighting an ongoing battle between buyers and sellers. However, current price action suggests a potential corrective phase before any decisive breakout.
Technical Analysis
The Daily Chart
Bitcoin has continued its impulsive surge after breaking above the crucial $90K threshold, reaching the $97K resistance region. However, the bullish trend has temporarily stalled at this critical level, with the price struggling to break above it. The recent consolidation near $97K reflects the presence of supply and a clear battle between buyers and sellers.
Additionally, the 100-day moving average has crossed below the 200-day moving average, forming a death cross, which could signal weakening momentum. Given the current structure, Bitcoin appears poised for a short-term corrective pullback or consolidation toward the $90K area before any potential breakout above the $97K resistance.
The 4-Hour Chart
On the lower timeframe, Bitcoin’s struggle at the $97K mark is even more pronounced. After reaching this resistance, the price gradually lost bullish momentum, entering a consolidation phase between $93K and $97K.
A noticeable bearish divergence between the price and the RSI indicator suggests that sellers are gaining strength. This further supports the likelihood of a short-term correction. As it stands, a consolidation or minor retracement within the $93K–$97K range is the most probable scenario before the market gains enough momentum to breach this resistance.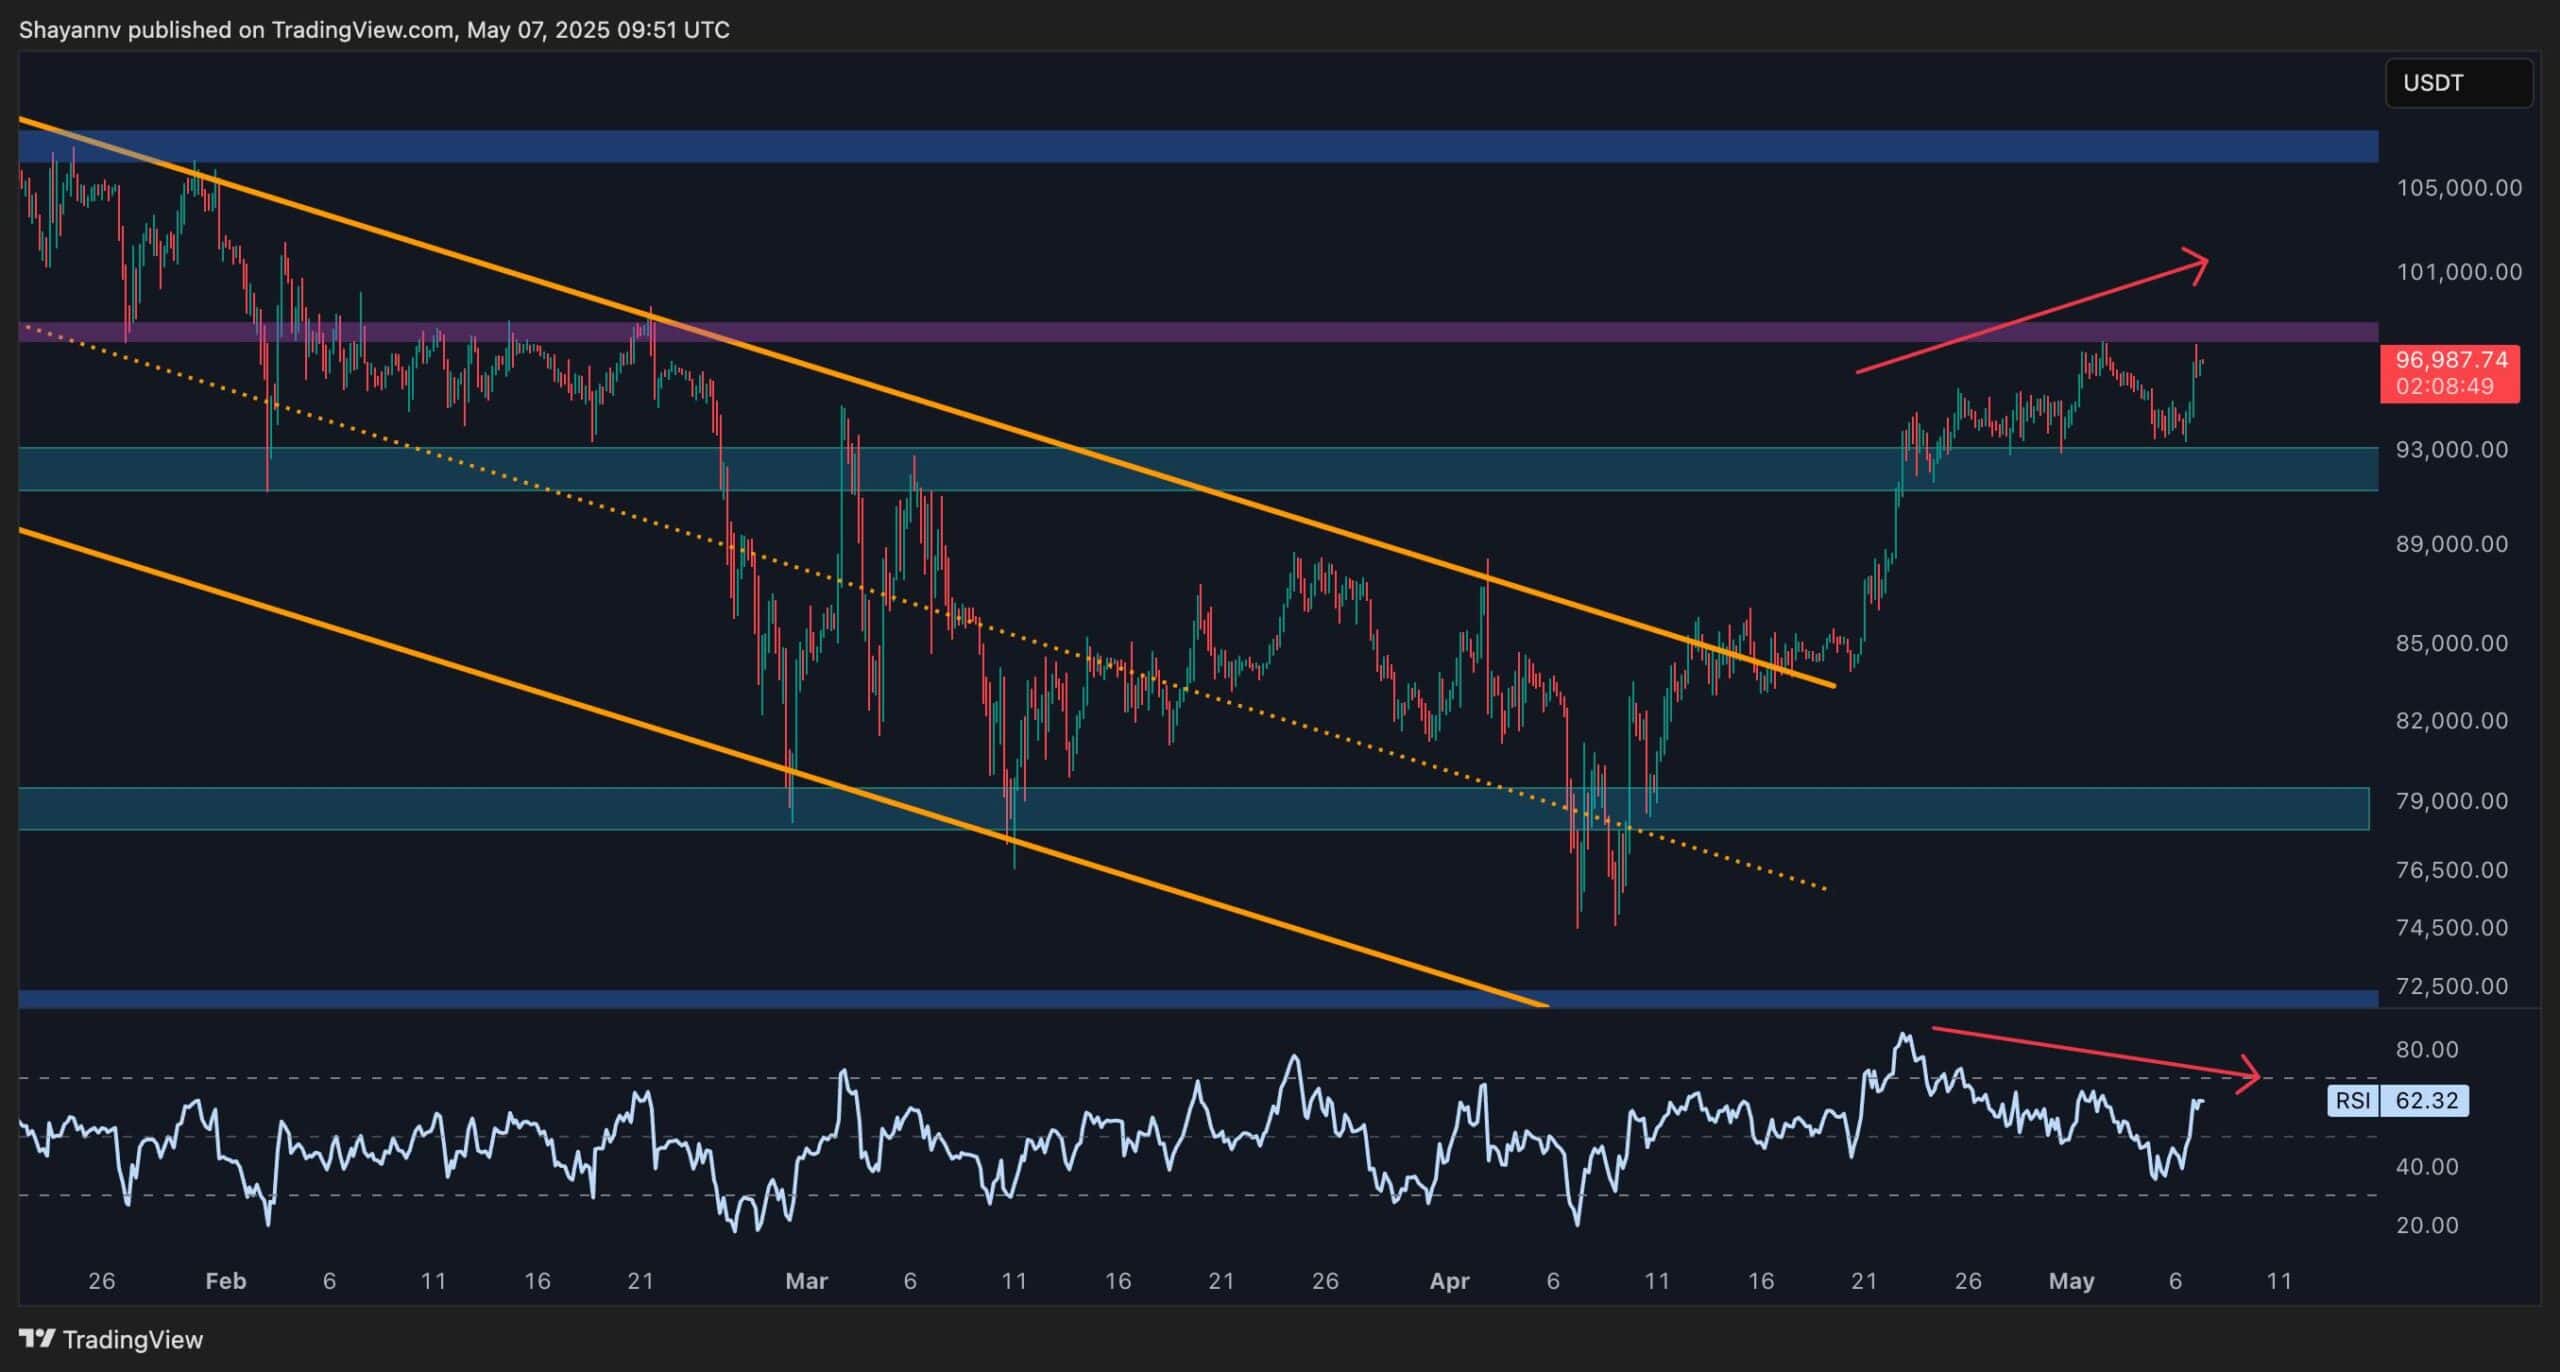
On-chain Analysis
By ShayanMarkets
While Bitcoin consolidates at a key level, analyzing futures market metrics offers valuable insight. The chart displays the BTC/USDT Binance liquidation heatmap, highlighting major liquidity pools that could attract price movement.
As shown, two significant liquidity zones exist—one above the $97K level and another below $93K, both near the current price. These areas are likely targets for smart money to trigger liquidations of retail traders. A breakout beyond either threshold could lead to a liquidation cascade and amplify the subsequent move.
Given the market’s overall bullish bias, a temporary dip below $93K remains possible before Bitcoin attempts a breakout above the $97K resistance.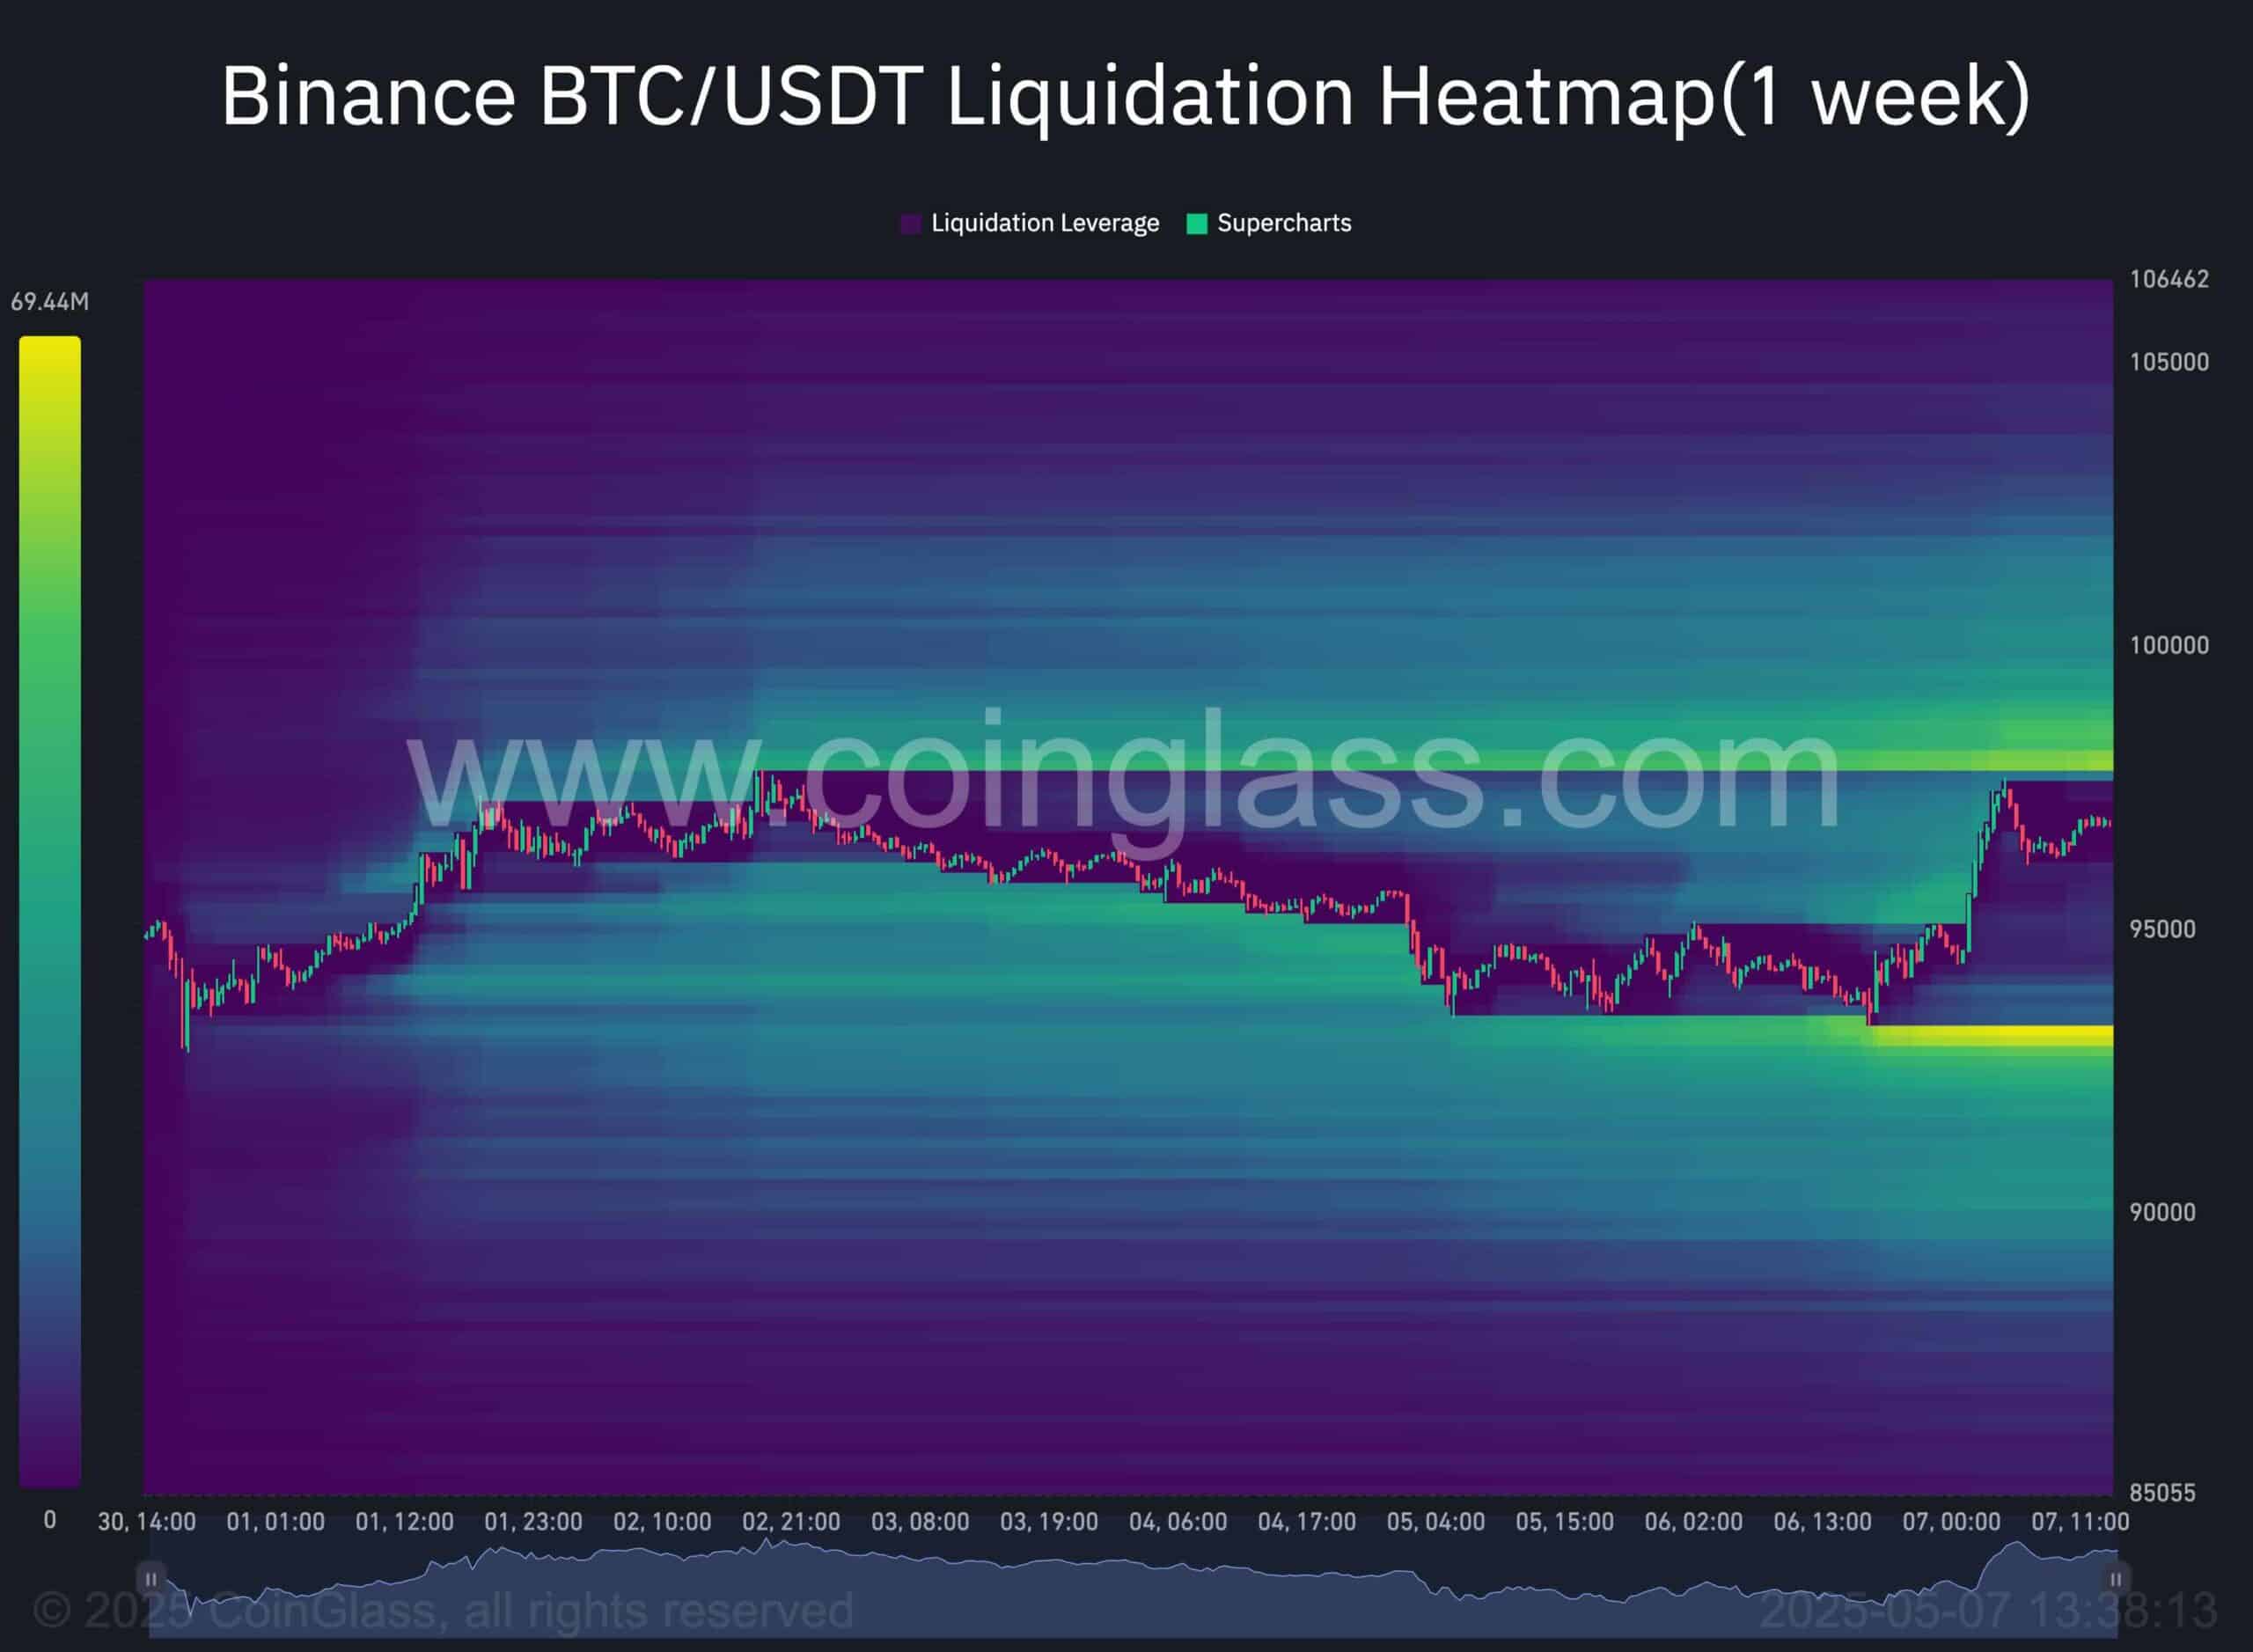
The post Bitcoin Price Analysis: BTC Approaches $97K Resistance Amid Emerging Warning Signals appeared first on CryptoPotato.