Bitcoin Price Analysis: BTC $1,000 Daily Impressive Recover, But Still In The Danger Zone
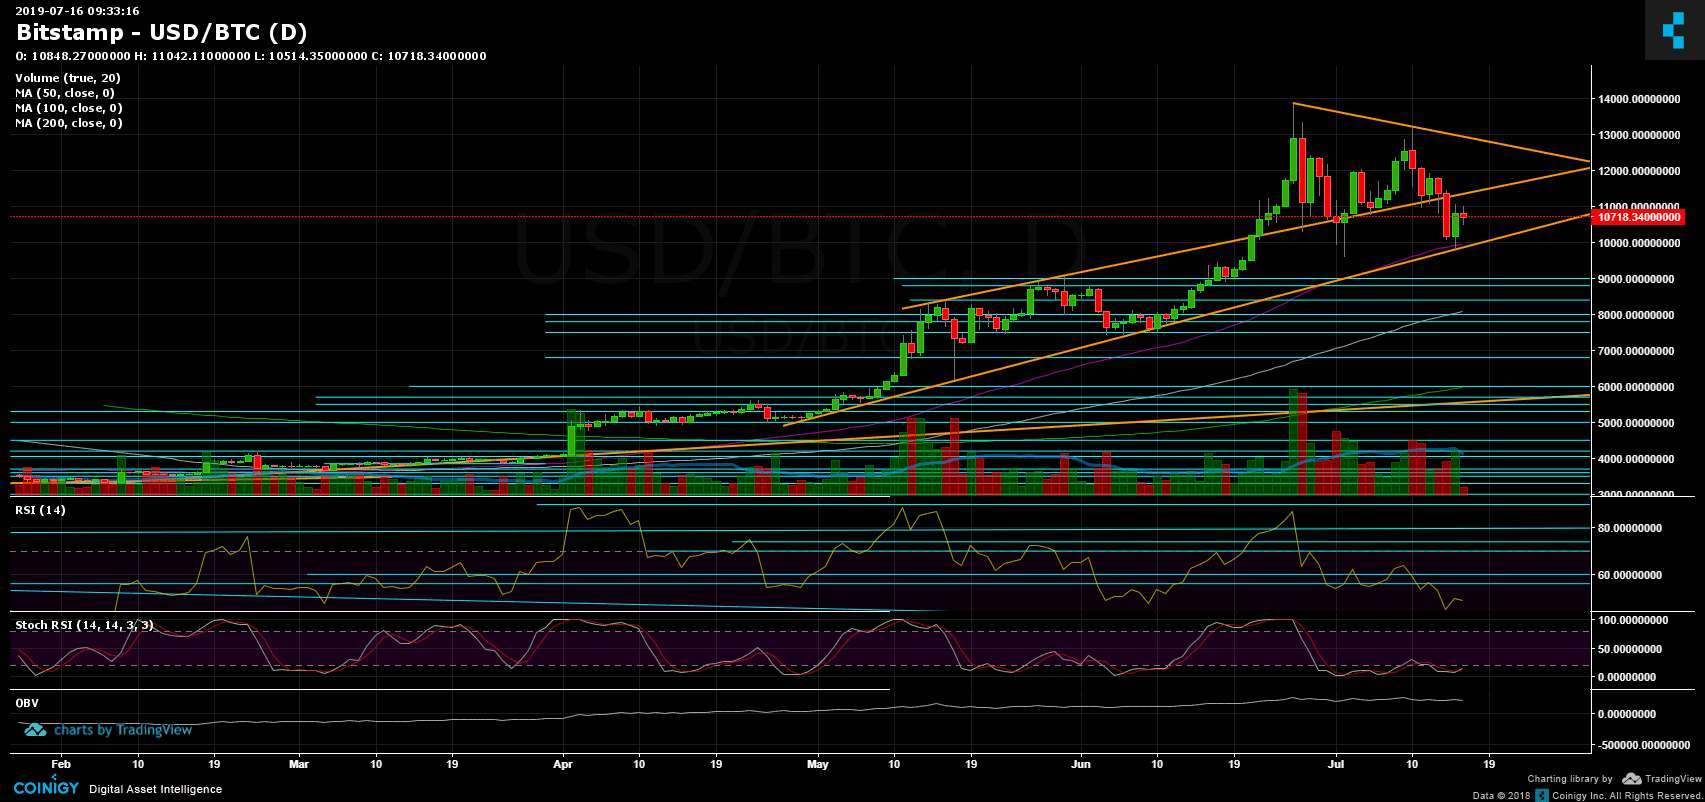
On our recent Bitcoin price analysis, we mentioned that Bitcoin is breaking down the mid-term ascending supporting trend-line at around $11,200.
Since the breakdown, we saw Bitcoin plunging another $1400 on the daily to reach the significant support at $9,800. This was mentioned here as a possible support area since the level contains the daily chart’s 50-days moving average line (marked in purple on the following chart). As can be seen, this is also the lower ascending trend-line marked, which was started forming somewhere at the end of April of this year.
Looking at the daily, we saw a beautiful reversal candle, followed by a decent amount of volume. However, Bitcoin is still in the danger zone.
As can be seen on the macro-level analysis, Bitcoin had retested the seven-year-old ascending trendline (log chart) but from below, now as resistance.
Another thing to note is the RSI, which is producing lower highs on the daily chart. If the momentum indicator doesn’t go back bullish, at least above the 52-53 level, this can forecast some short-term bearish action for Bitcoin.
Some optimism is that the recent correction found support at $9,800, which on the daily level is higher than the prior low at $9600 (from July 2nd).
Total Market Cap: $288 billion
Bitcoin Market Cap: $191.7 billion
BTC Dominance Index: 66.6% (New 2019 high)
*Data by CoinGecko
Key Levels to Watch
– Support/Resistance:
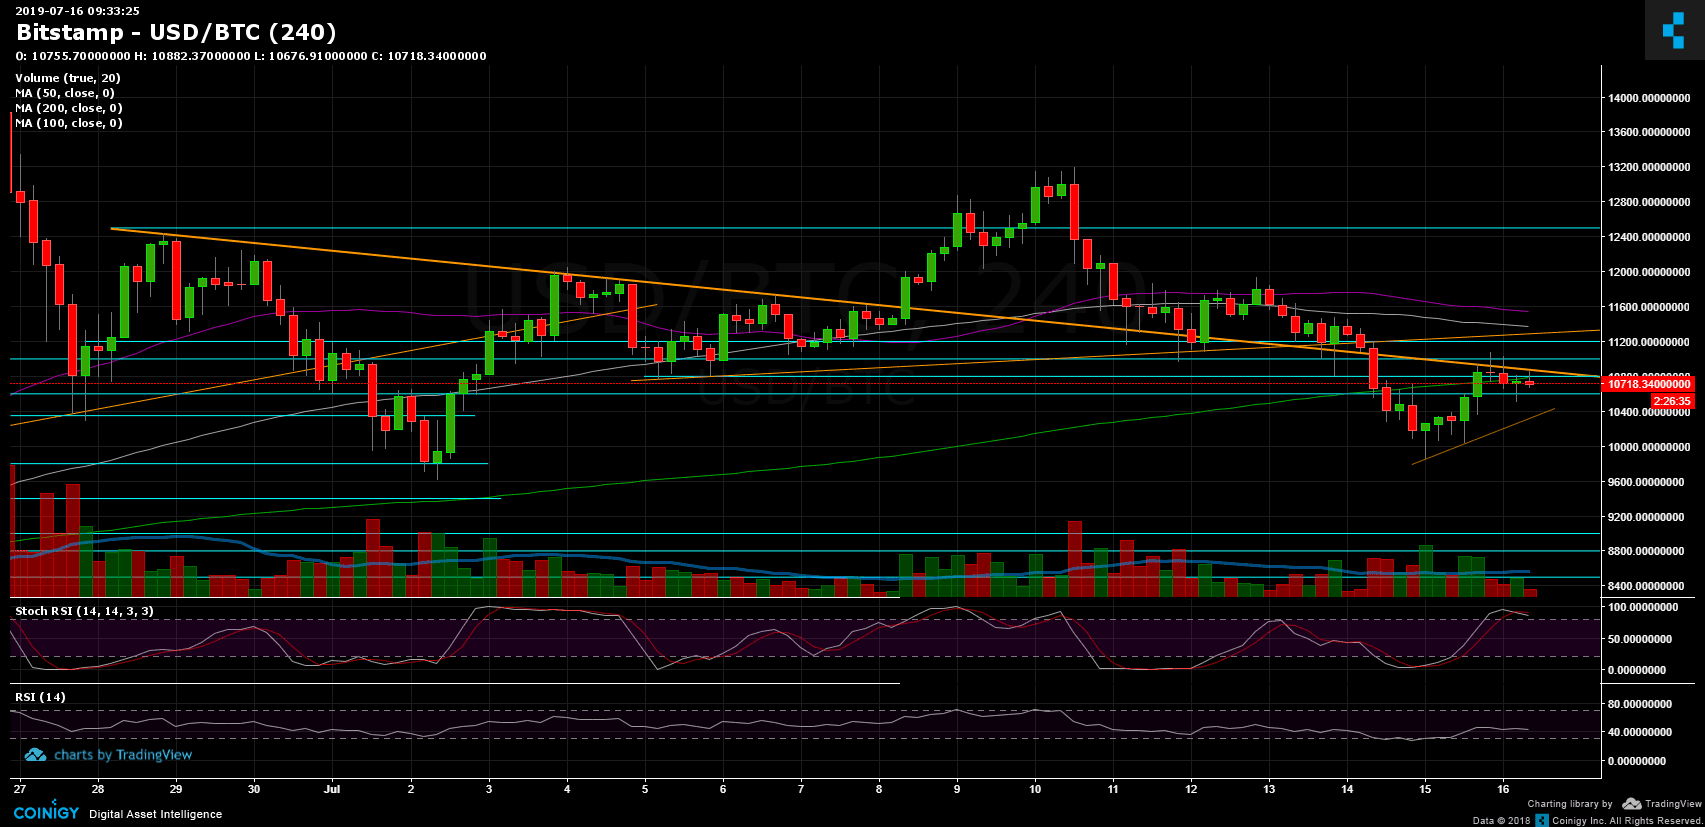
From above, Bitcoin is facing the crucial $11,000 – $11,200 resistance area, which has a lot of supply. Breaking above and the next resistance area will be $11,500 – $11,600, along with the mid-term ascending trend line (the upper one). Above lies the $12,000 and $12,500.
From the bearish side, the next support area lies at $10,600. Further below is $10,300, $10,000 and $9,800 (50-days MA). Below lies $9,600, which is the low since the parabolic move had begun, and $9,400 – a significant support level of the previous double top from June.
– Daily chart’s RSI: Discussed above. Stochastic RSI oscillator is at the oversold territory, however, hadn’t entered the bullish zone yet.
– Trading Volume: discussed above.
– BitFinex open short positions: Over the past days the bears had closed their short positions, whereas the number of open shorts lies at 5.3K BTC positions, which is near the yearly lows. Keep in mind the recent manipulations during the past week of a sudden 65% drop in the shorts number.
BTC/USD BitStamp 4-Hour Chart
BTC/USD BitStamp 1-Day Chart
The post Bitcoin Price Analysis: BTC $1,000 Daily Impressive Recover, But Still In The Danger Zone appeared first on CryptoPotato.