Bitcoin Price Analysis: Back Above $50K, But Facing Huge Resistance Now
Bitcoin is up by a solid 6% today as the primary cryptocurrency surged by over $3000 over the past 24 hours.
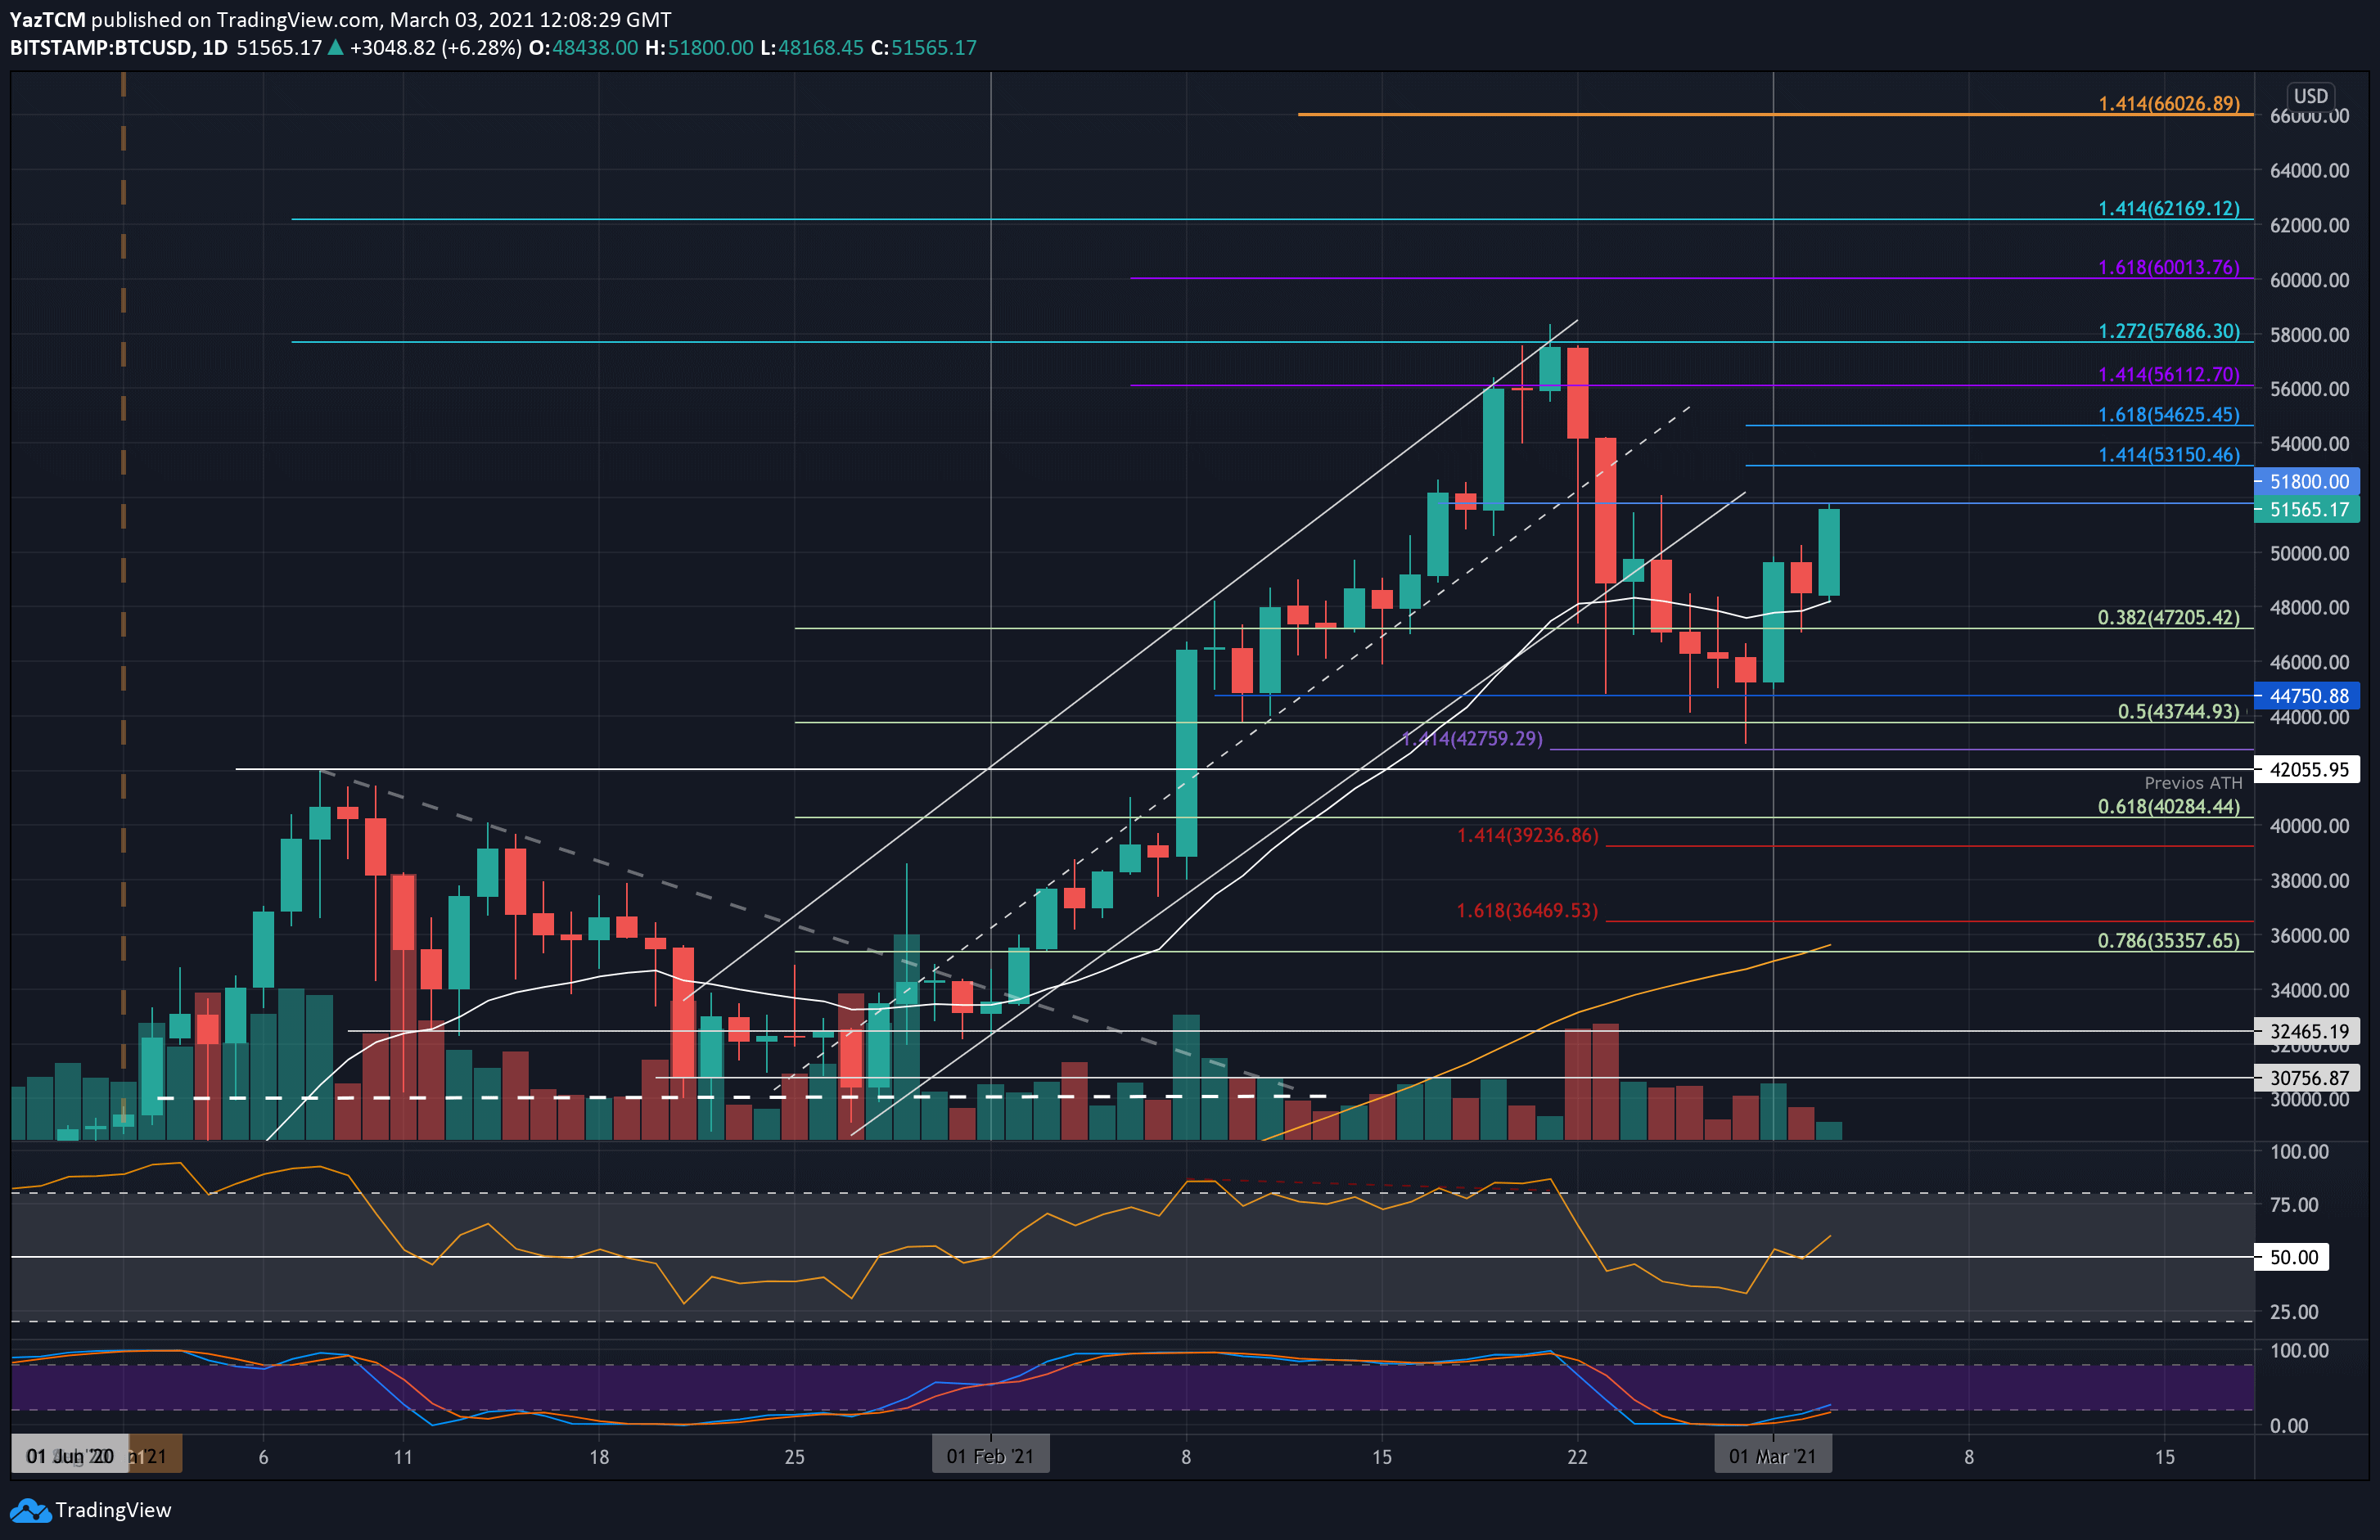
Quick recap: bitcoin is recovering after a heavy correction over the past week, in which the cryptocurrency dropped by around 25% as it broke beneath the February ascending price channel (as shown on the daily chart below) and tumbled into the support around $43K – $44K.
It managed to rebound nicely from there, breaking above a falling wedge, as we mentioned on Monday. After touching $50K, yesterday Bitcoin corrected to $47K but managed to quickly recover (candle wicks on the short-term timeframes in favor of the bulls), and today, following the breakout of the critical daily EMA-20 line at around $48,200, Bitcoin was able to spike back above $50K.
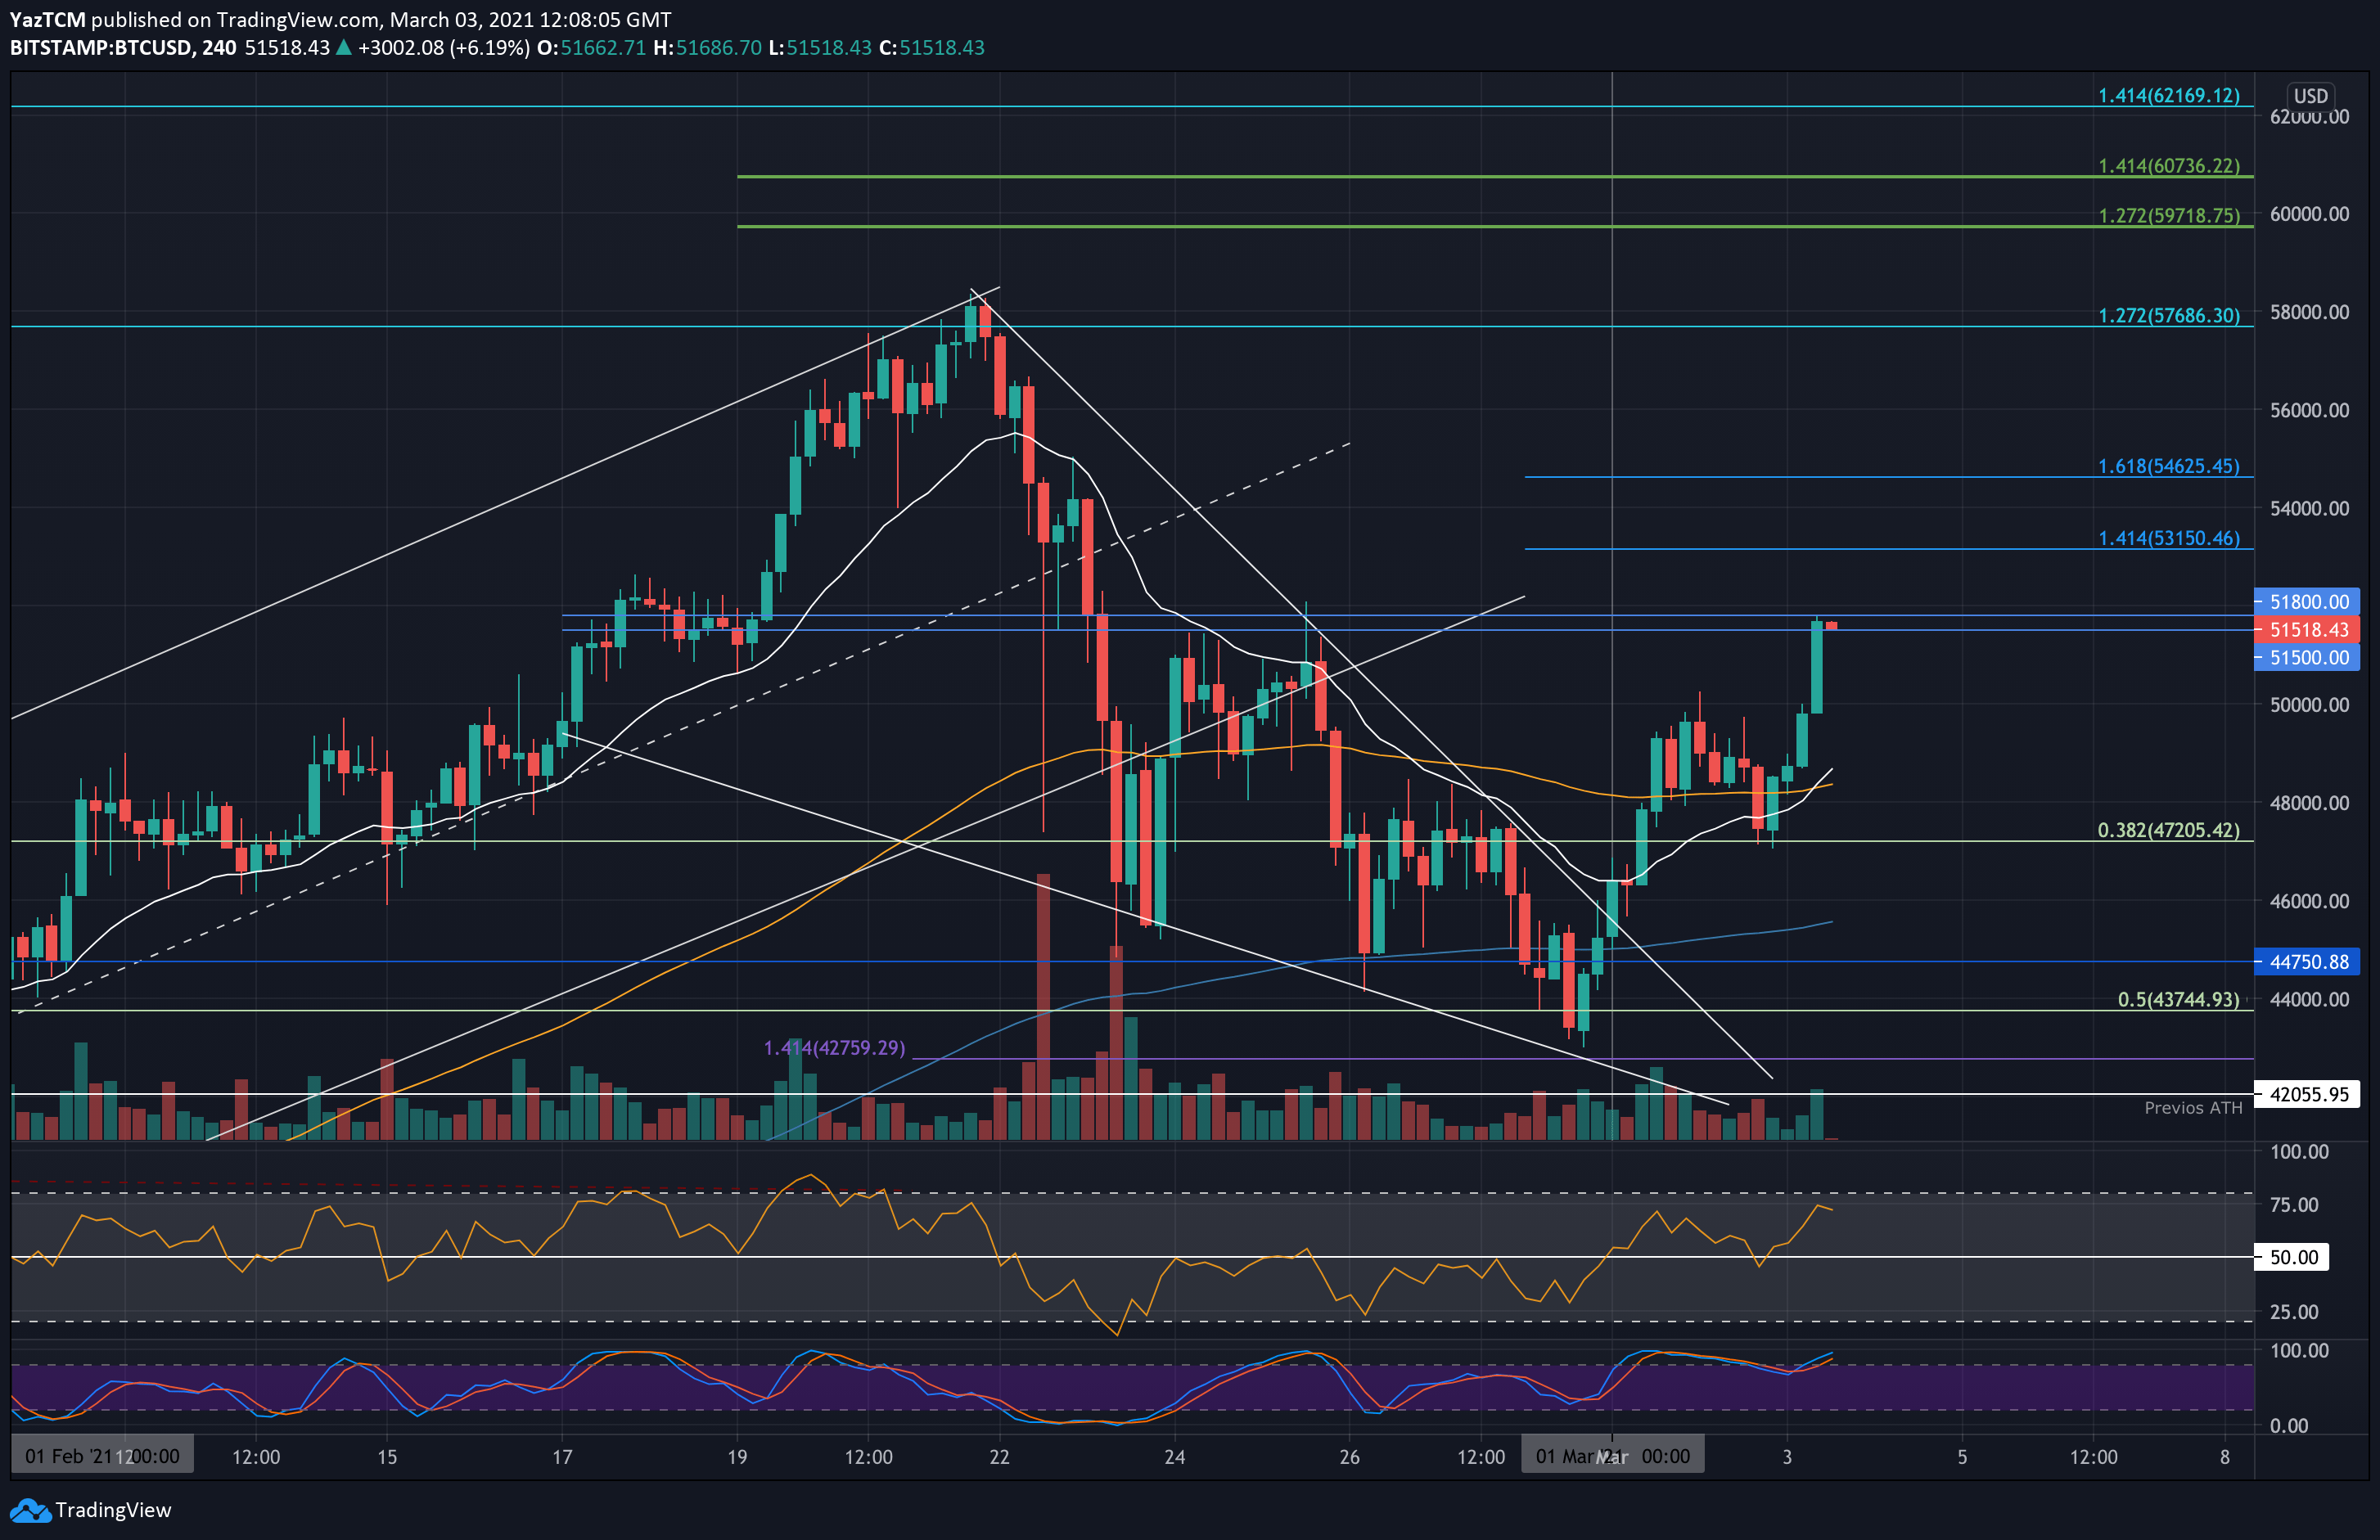
As of now, Bitcoin is facing a huge horizontal resistance area between $51,400 and $51,800.
BTC Price Support and Resistance Levels to Watch
Key Support Levels: $50,000, $48,000, $47,200, $46,000, $44,750.
Key Resistance Levels: $51,400, $51,800 – $52,000, $53,150, $54,000, $54,625, $56,000.
Moving forward, the first level of resistance lies at $51,800. This is closely followed by $52,000. Beyond this, additional resistance lies at $53,150 (short term 1.414 Fib Extension), $54,000, $54,625 (short term 1.618 Fib Extension), and $56,000.
On the other side, the first support lies at $50,000. This is followed by $48,000 (20-EMA line), $47,200 (.382 Fib and yesterday’s low), $46,000, and $44,750.
The daily RSI is now back above the midline as the buyers re-take control of the market momentum. If it continues to rise above 50, the bullish momentum will increase and push BTC back to the ATH levels again.
Bitstamp BTC/USD Daily Chart
Bitstamp BTC/USD 4-Hour Chart