Bitcoin Price Analysis August 30
As reported on our previous analysis, market was overbought and needed a correction after testing the $7000 strong resistance zone, where lies the Moving Average 200 days line.
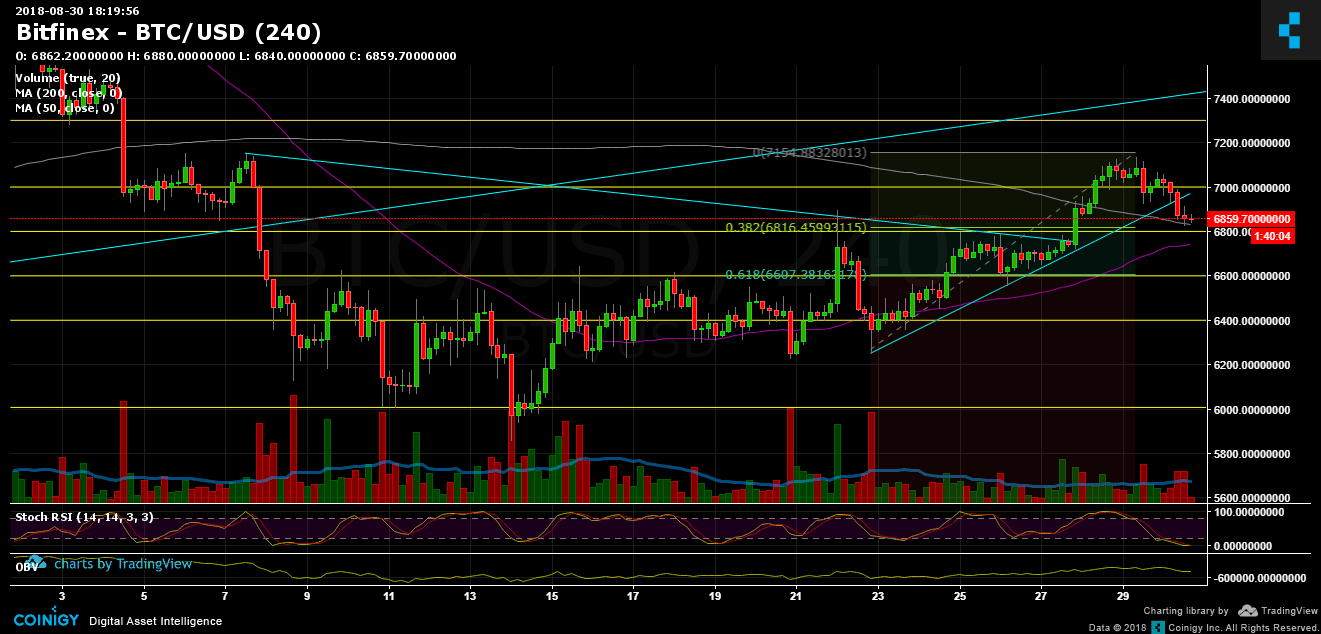
The correction might stop in these areas (~$6800) where there is a resistance-turned support level along with Fibonacci retracement %38.2 level. RSI levels are at low levels, despite Scholastic RSI oscillator hadn’t crossed yet. This supports the option of the market being oversold.
Next major support lies around $6730 (Moving Average 50 days) and then $6600 area (strong support combined with %61.8 Fibonacci retracement level.
Besides the technical analysis, there is a major event tomorrow around 15:00 PM UTC time – the expiration of CME Group’s August 2018 Bitcoin Futures. This event might have a significant effect on the Bitcoin market to either direction.
To sum up
Support levels lie at $6800, $6730 (MA-50 – purple line in the chart), $6600.
Resistance levels lie at $7000, $7250, $7600 (the long-term descending line).
Bitcoin Prices: BTC/USD BitFinex 4 Hours chart
The post Bitcoin Price Analysis August 30 appeared first on CryptoPotato.