Bitcoin Price Analysis April 25: Critical Decision Point For BTC – a Double Top or Hold Support?
Since our previous BTC price analysis, and following the trend, the Bitcoin breakout had reached a daily high of $5627 on Bitstamp. This is still not our expected target (around $5700 – $5800), however, this is crypto and anything can change anytime.
Since yesterday, the crypto markets are suffering from severe declines: Both in Bitcoin and especially among the altcoins. This includes Ripple that keeps decreasing against Bitcoin since 2019 had begun.
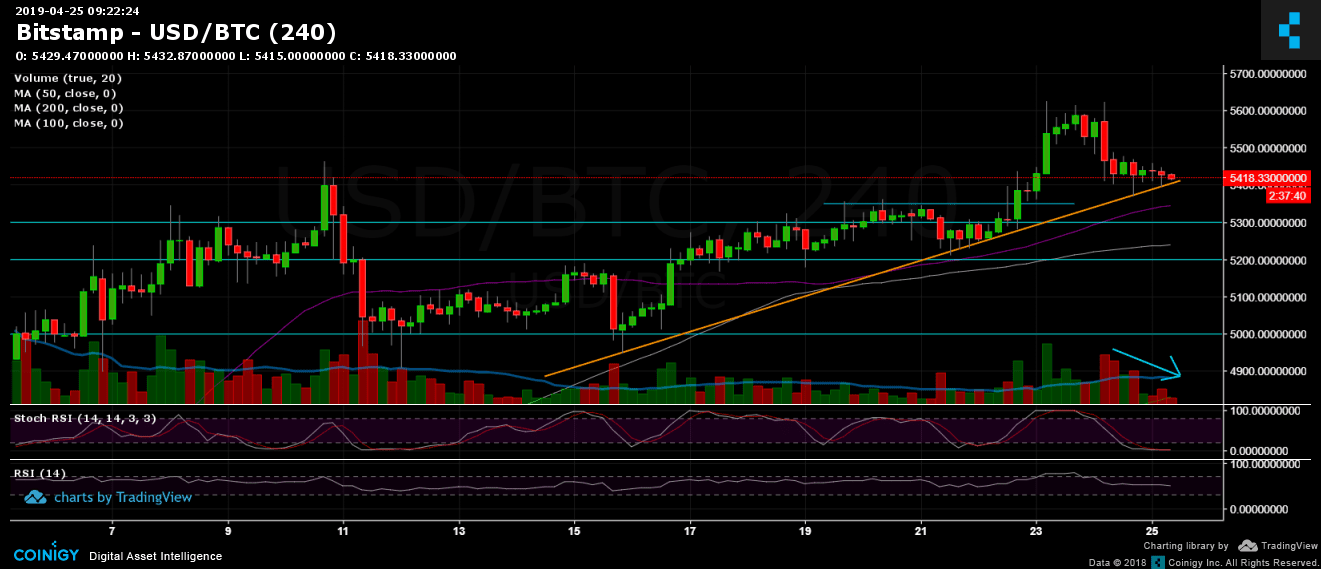
A quick overview to keep things simple: the hourly and the 4-hours chart reveal a double top in Bitcoin around $5625. This setting is a bearish formation. From the other side, Bitcoin is still getting support from the mid-term trend-line on the 4-hour chart, along with the stiff resistance turned support area at $5300 – $5350.
Total Market Cap: $176 Billion
Bitcoin Market Cap: $96.3 Billion
BTC Dominance: 54.6%
Looking at the 1-day & 4-hour charts
– Support/Resistance:
As mentioned above, Bitcoin is very close to the ascending trend-line marked in orange on the 4-hour chart, along with the $5400 support area. This trend-line is holding nicely for the past ten days. The next critical support level is the resistance turned support $5300 – $5350 zone. Below lie the $5200, $5100 and $5000 support levels.
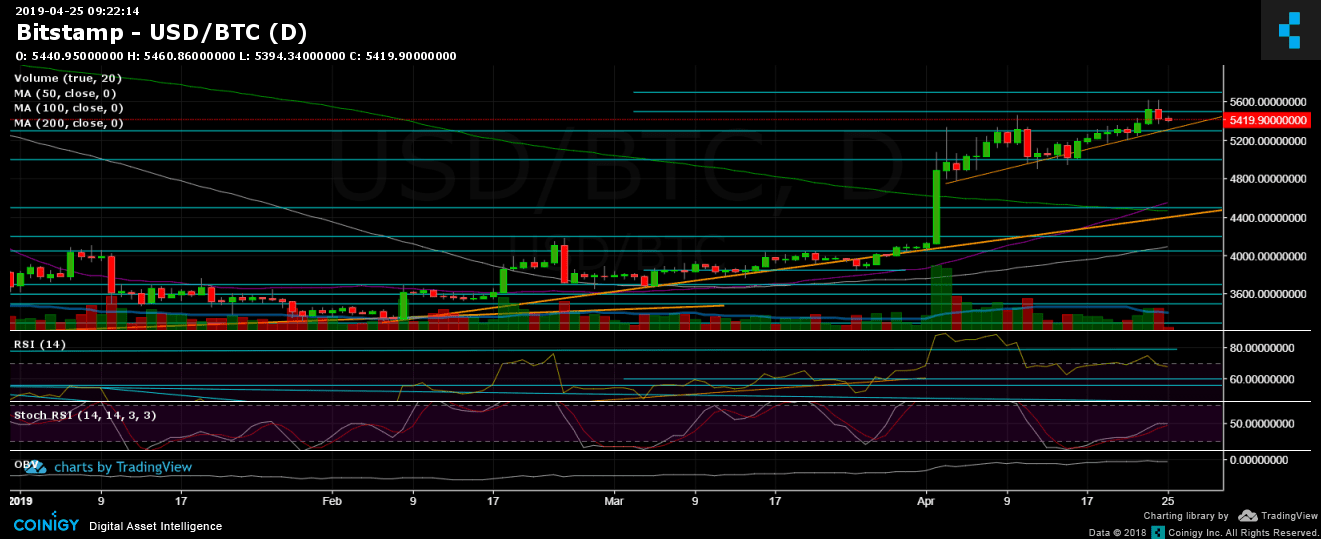
From above, after failing to break-out the previous high at $5625, Bitcoin marked $5500 as the closest resistance level. Above, lies the mentioned $5600 – $5625 resistance, before reaching to the major area of $5700 – $5800, which held the 2018 bear market as last support level throughout 2018. In case of a break-up, the $6000 level is not expected to be easier to overcome.
– Trading Volume: looking on the 4-hour chart, we see that the sellers’ candles (in red) are decreasing over the past two days. This could turn bullish, combined with the Stochastic RSI oscillator which is deep in the oversold area.
– Daily chart’s RSI: The RSI level had dumped down to 68, which is considered a support range. It will be interesting to see if it can find the necessary support here.
– BitFinex open short positions: the number of short positions continues growing up over the past days, and currently stands at 25.7K BTC open short positions.
BTC/USD BitStamp 4-Hour Chart
BTC/USD BitStamp 1-Day Chart
The post Bitcoin Price Analysis April 25: Critical Decision Point For BTC – a Double Top or Hold Support? appeared first on CryptoPotato.