Bitcoin Price Analysis: After Breaking ATH, Those Are The Next Possible Targets for BTC
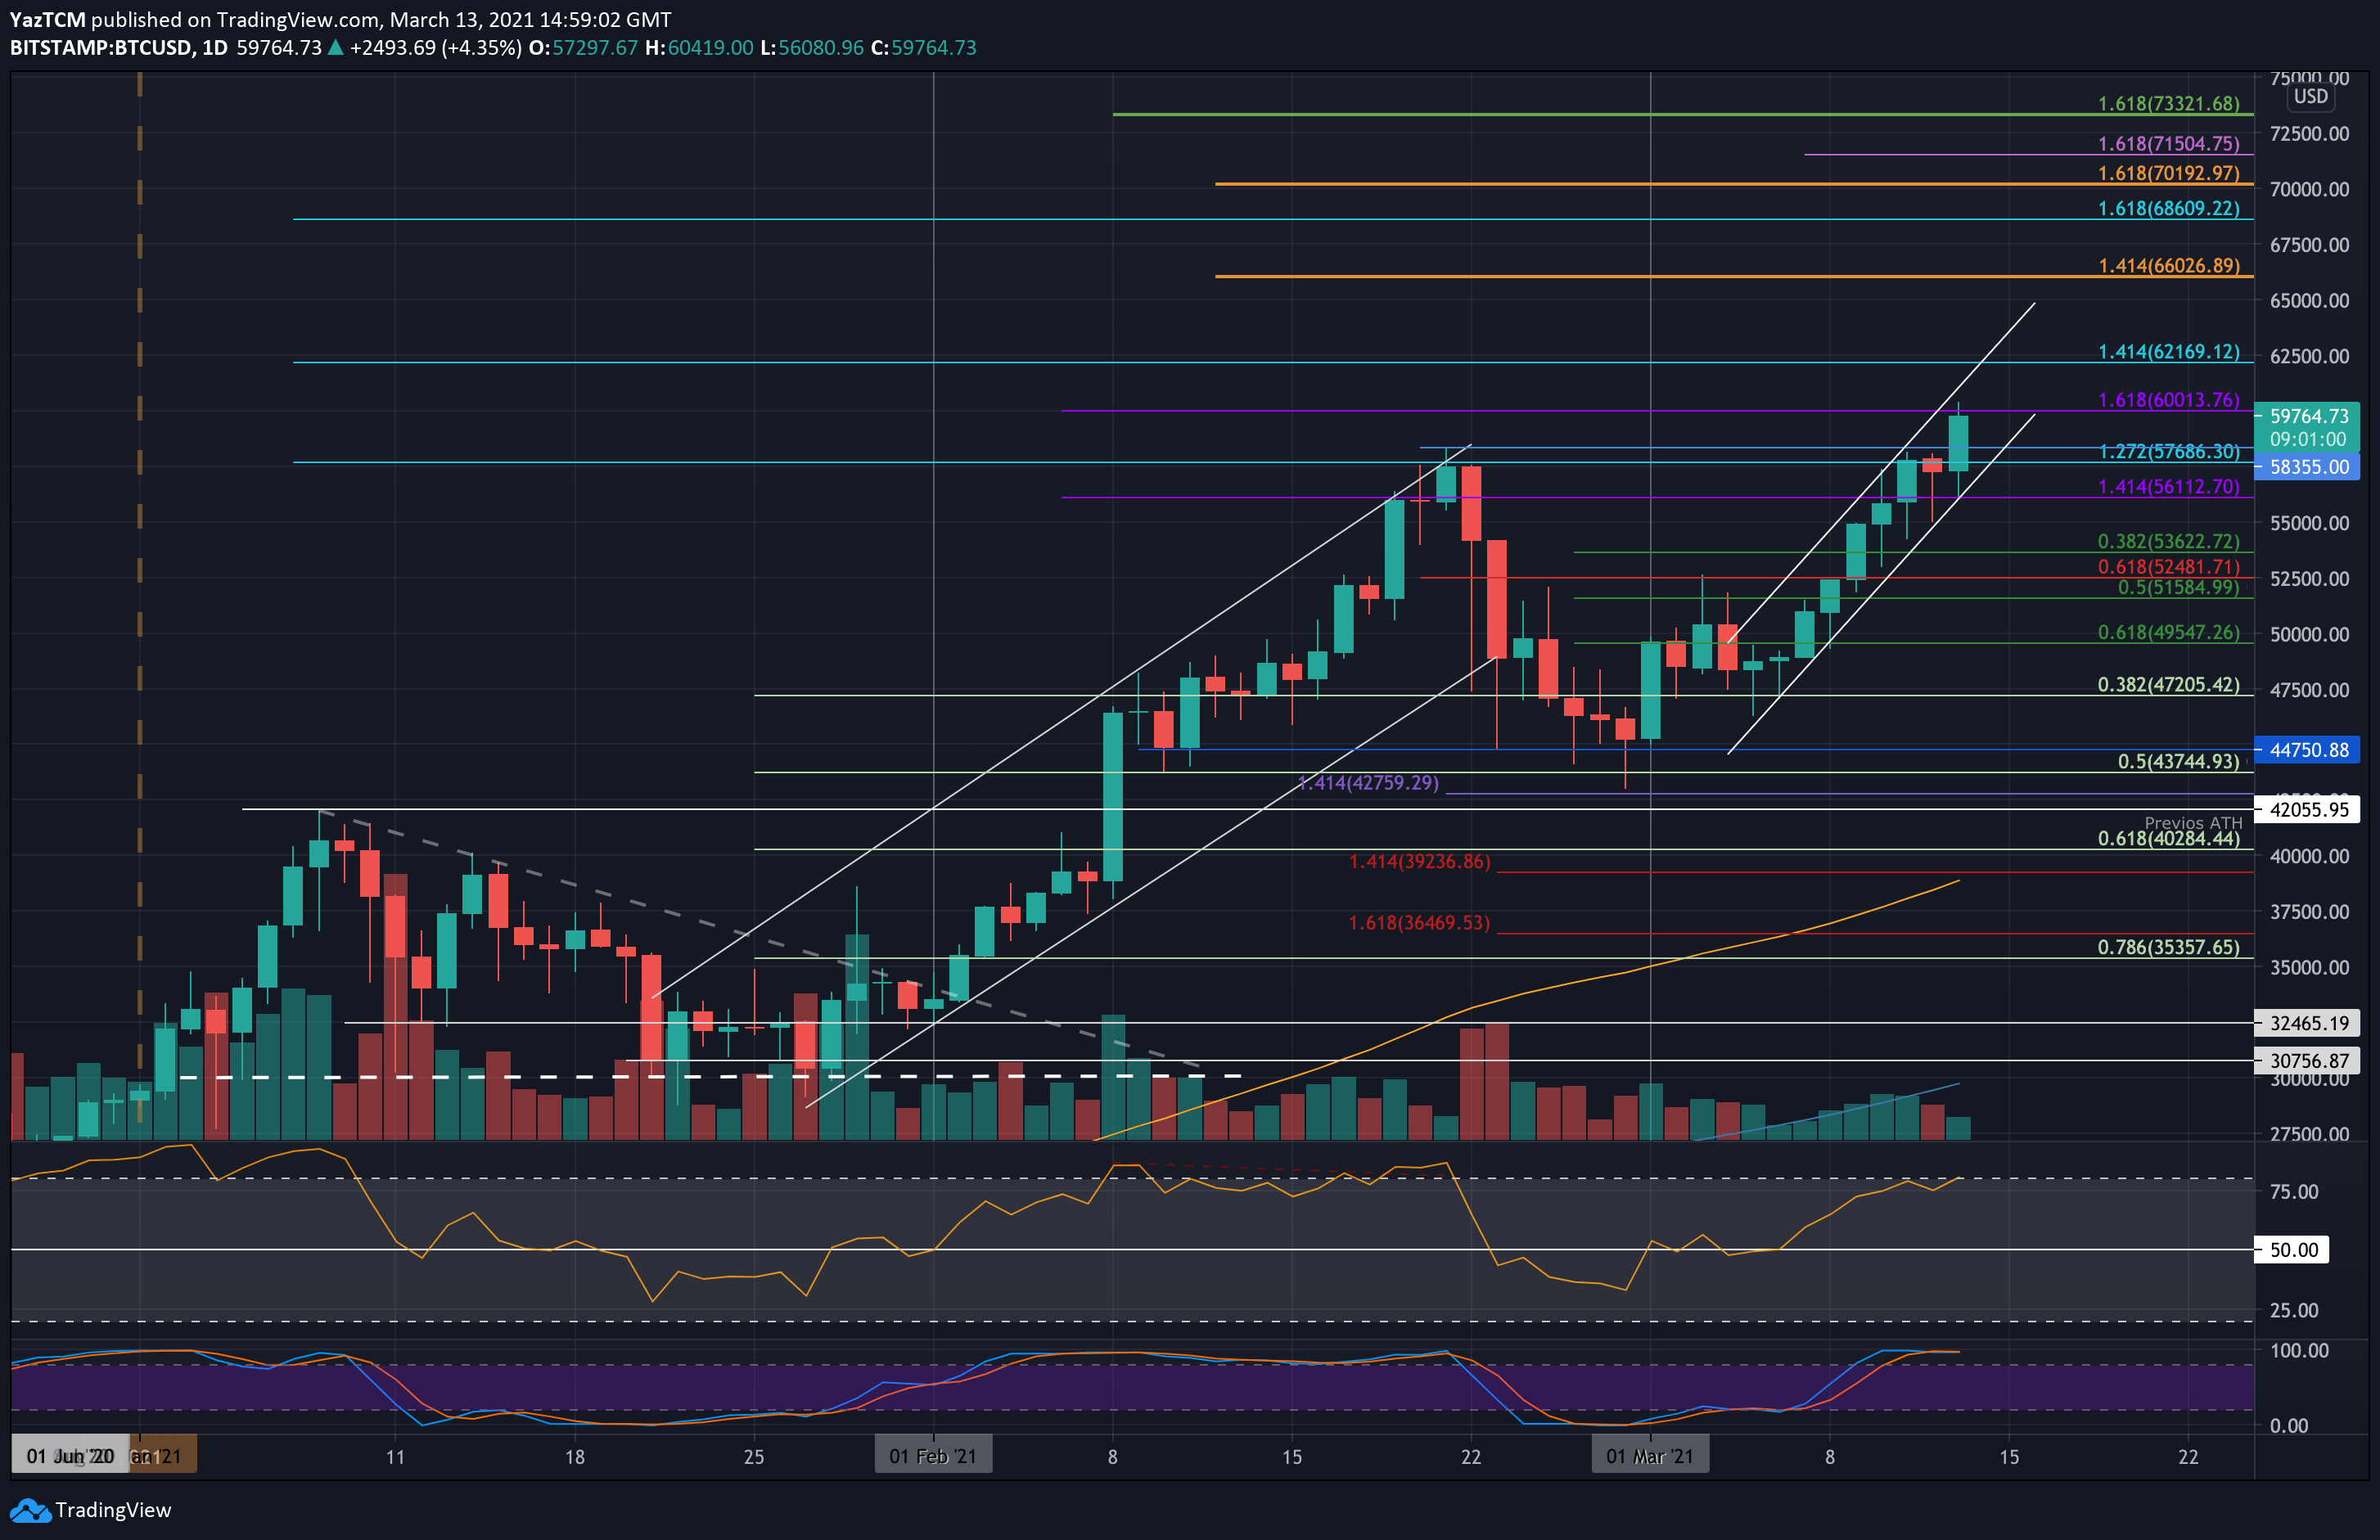
Bitcoin set a new ATH today after surging by over 6% reaching above the $60,000 milestone. As of writing these lines, the new all-time high now lies at $60,420 according to Bitstamp.
Just a week ago, Bitcoin had rebounded from support at $47,200 (.382 Fib). Initially, it struggled with resistance at $52,500 (bearish .618 Fib) but after some consolidation time, there came a breakout, which was followed by a constant increase over the past week as can be seen on the daily chart below. The peak happened today, as Bitcoin broke its previous ATH recorded on February 21, 2021, when it surpassed $58,500.
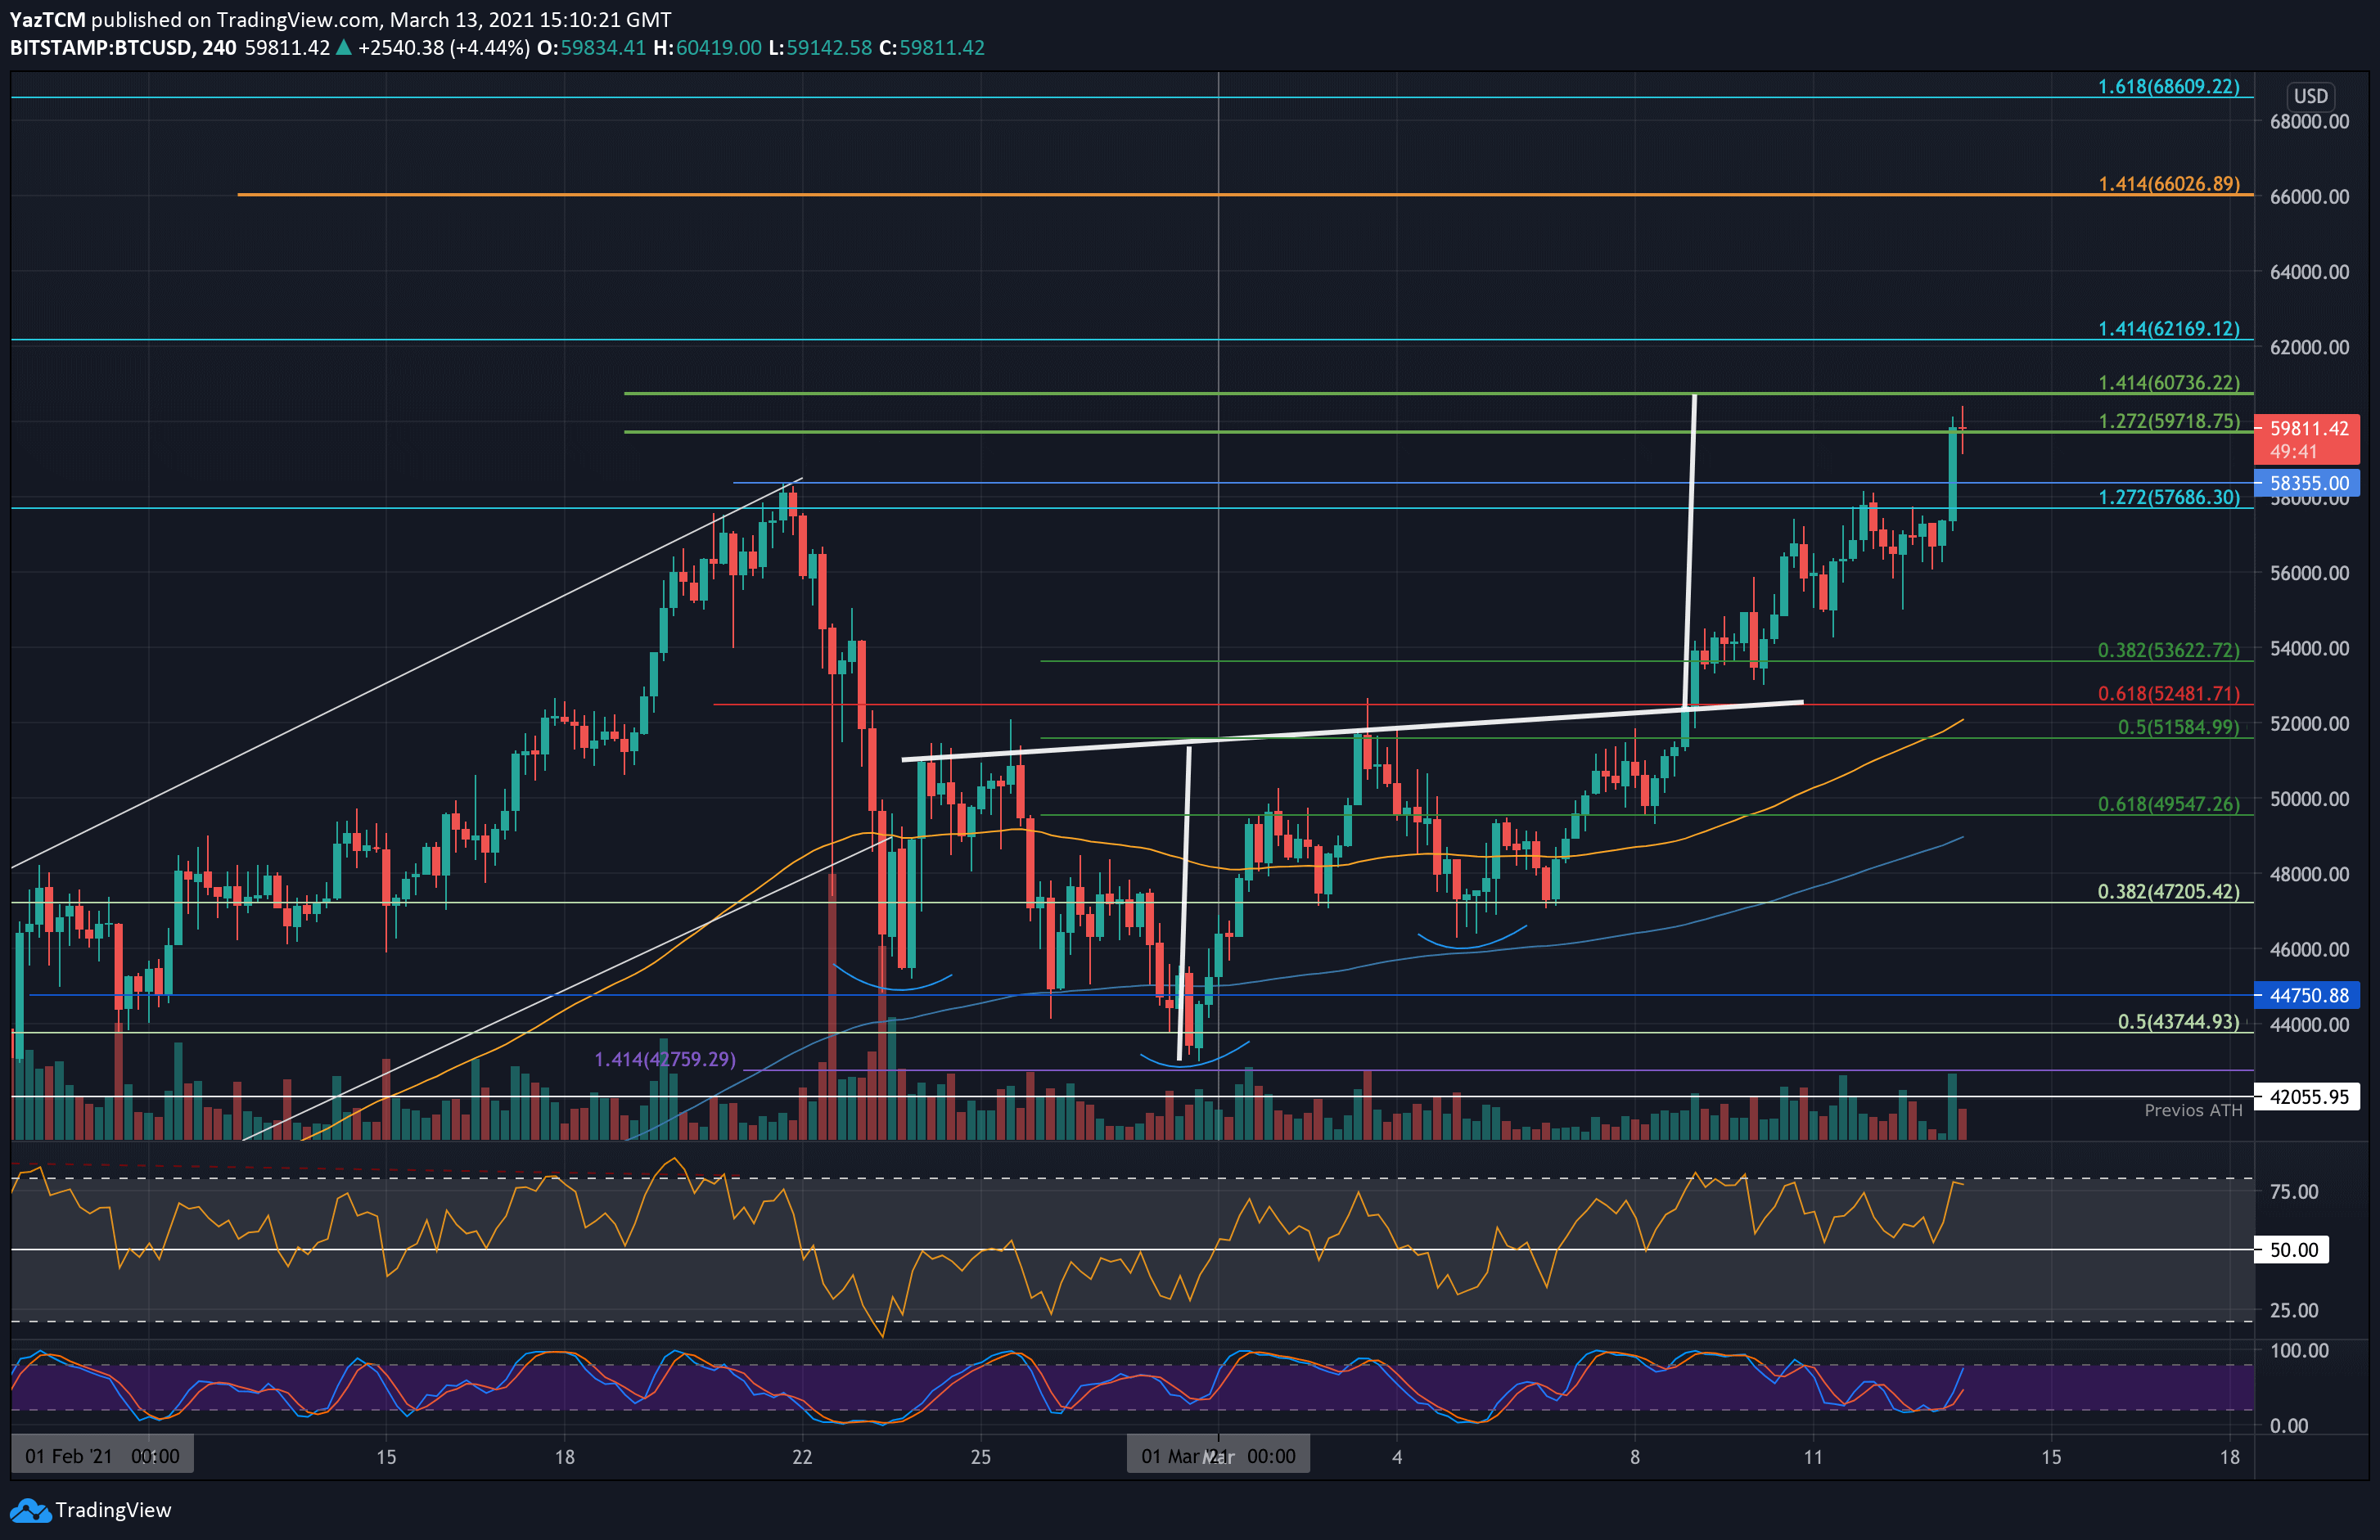
In doing so, Bitcoin also crossed the neckline of a bullish inverse Head & Shoulders pattern with a target at $60.5K, marked on the following 4-hour chart. The target was reached just hours ago.
If there won’t be any last-minute surprises, this week might turn into one of the best for BTC. So far, Bitcoin had gained over 20% just this week.
BTC Price Support and Resistance Levels to Watch
Key Support Levels: $58,355, $57,690, $56,110, $55,000, $52.5K – $52,633.
Key Resistance Levels: $60,000, $60,736, $62,170, $65,000, $66,000, $70K.
Looking ahead, the first level of resistance lies at $60,000. This is followed by $60,500 – $60,736 (current ATH and short term 1.414 Fib), $62,170 (1.414 Fib Extension & upper boundary of the current price channel), $65,000, and $66,000 (1.414 Fib Extension – orange). Further above lies $70K.
On the other side, the first support lies at $58,355 (previous ATH). This is followed by $57,690 (lower boundary of price channel), $56,110 (previous resistance), $55,000, and $52.5K – $52,633 (.382 Fib).
The RSI is now approaching overbought conditions as it crosses the 80 level. This indicates the bulls are in complete control of the market momentum but might becoming overextended.
Nevertheless, the RSI was higher during early January and the mid-February price surges (previous $58.5K ATH set on February 21), suggesting that there is still room to push higher before the buyers become exhausted.
Bitstamp BTC/USD Daily Chart
Bitstamp BTC/USD 4-Hour Chart