Bitcoin Market Weakening After Macro-Based Sell-Off, On-Chain Data Suggests
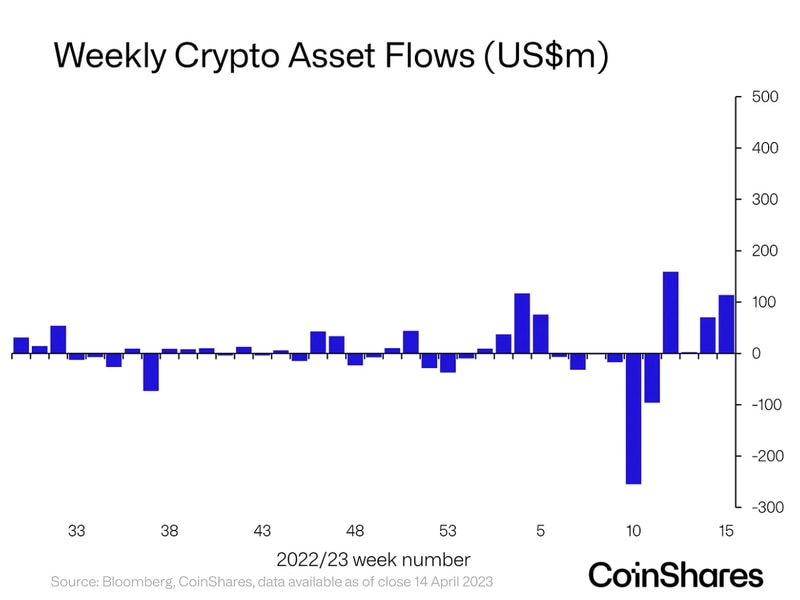
Bitcoin price chart for Wednesday (CoinDesk BPI)
Bitcoin Market Weakening After Macro-Based Sell-Off, On-Chain Data Suggests
Key bitcoin (BTC) on-chain metrics have flipped bearish this week, suggesting the top cryptocurrency by market cap may extend its recent price losses in the short term.
- On Tuesday, the net inflow of bitcoin to exchanges (measured by the total change in exchange balances) was 36,800 BTC – the biggest single-day rise since the markets crash on March 13, according to data source Chainalysis.
- “Since Sept. 20, the net daily inflow of bitcoins to exchanges have been increasing and trade intensity has been declining,” Philip Gradwell, an economist at Chainalysis, told CoinDesk.
- This, he said, “indicates a weakening market.”

- The uptick in net inflows represents an increase in selling pressure, since investors typically move coins from their wallets to exchanges when they see a possible need to liquidate their holdings.
- Further, bitcoin’s trade intensity, which measures the number of times an inflowing coin is traded, fell to a one-year low of 1.75 on Tuesday.
- That’s a sign there were not enough buyers to absorb the spiking inflow of coins.

- Trade intensity has declined from 4.93 to 1.75 in the last three days.
- “There is a lot of inventory building on exchanges and fewer buyers willing to trade. These conditions tend to lead to price declines,” Gradwell said.
Long-term bull bias intact
- Bitcoin fell by over 4.5% on Monday as investors bought the safe-haven U.S. dollar, but sold equities, gold and other fiat currencies on renewed coronavirus concerns.
- The drop set the stage for a continuation of the pullback from August highs above $12,400, according to the technical charts.
- Immediate supports are seen at $10,000 and $9,868 (Sept. 8 low).
- However, while bitcoin may suffer deeper declines in the short-term, the overall bias remains bullish.
- “We are still above $10,000, only the third time bitcoin has maintained this price level for multiple weeks, and long-term investors are buying bitcoin in increasing amounts,” Gradwell noted.
- The options market is also showing bullish bias on the longer time frames.
- The three- and six-month put-call skews remain below zero, a sign that bullish call options are drawing higher demand or prices compared to bearish put options.
- At press time, bitcoin is trading near $10,477, up slightly on the day, according to CoinDesk’s Bitcoin Price Index.