Bitcoin in Search for a Direction, Will $24K Finally Fall? (BTC Price Analysis)
Bitcoin’s price has been consolidating between the $20K and $24K level over the last couple of months, after a rapid crash from the $30K level. The $17K-$20K support area has been holding well, pushing the cryptocurrency higher towards the $24K resistance on multiple occasions but has so far failed to overcome it.
Technical Analysis
By: Edris
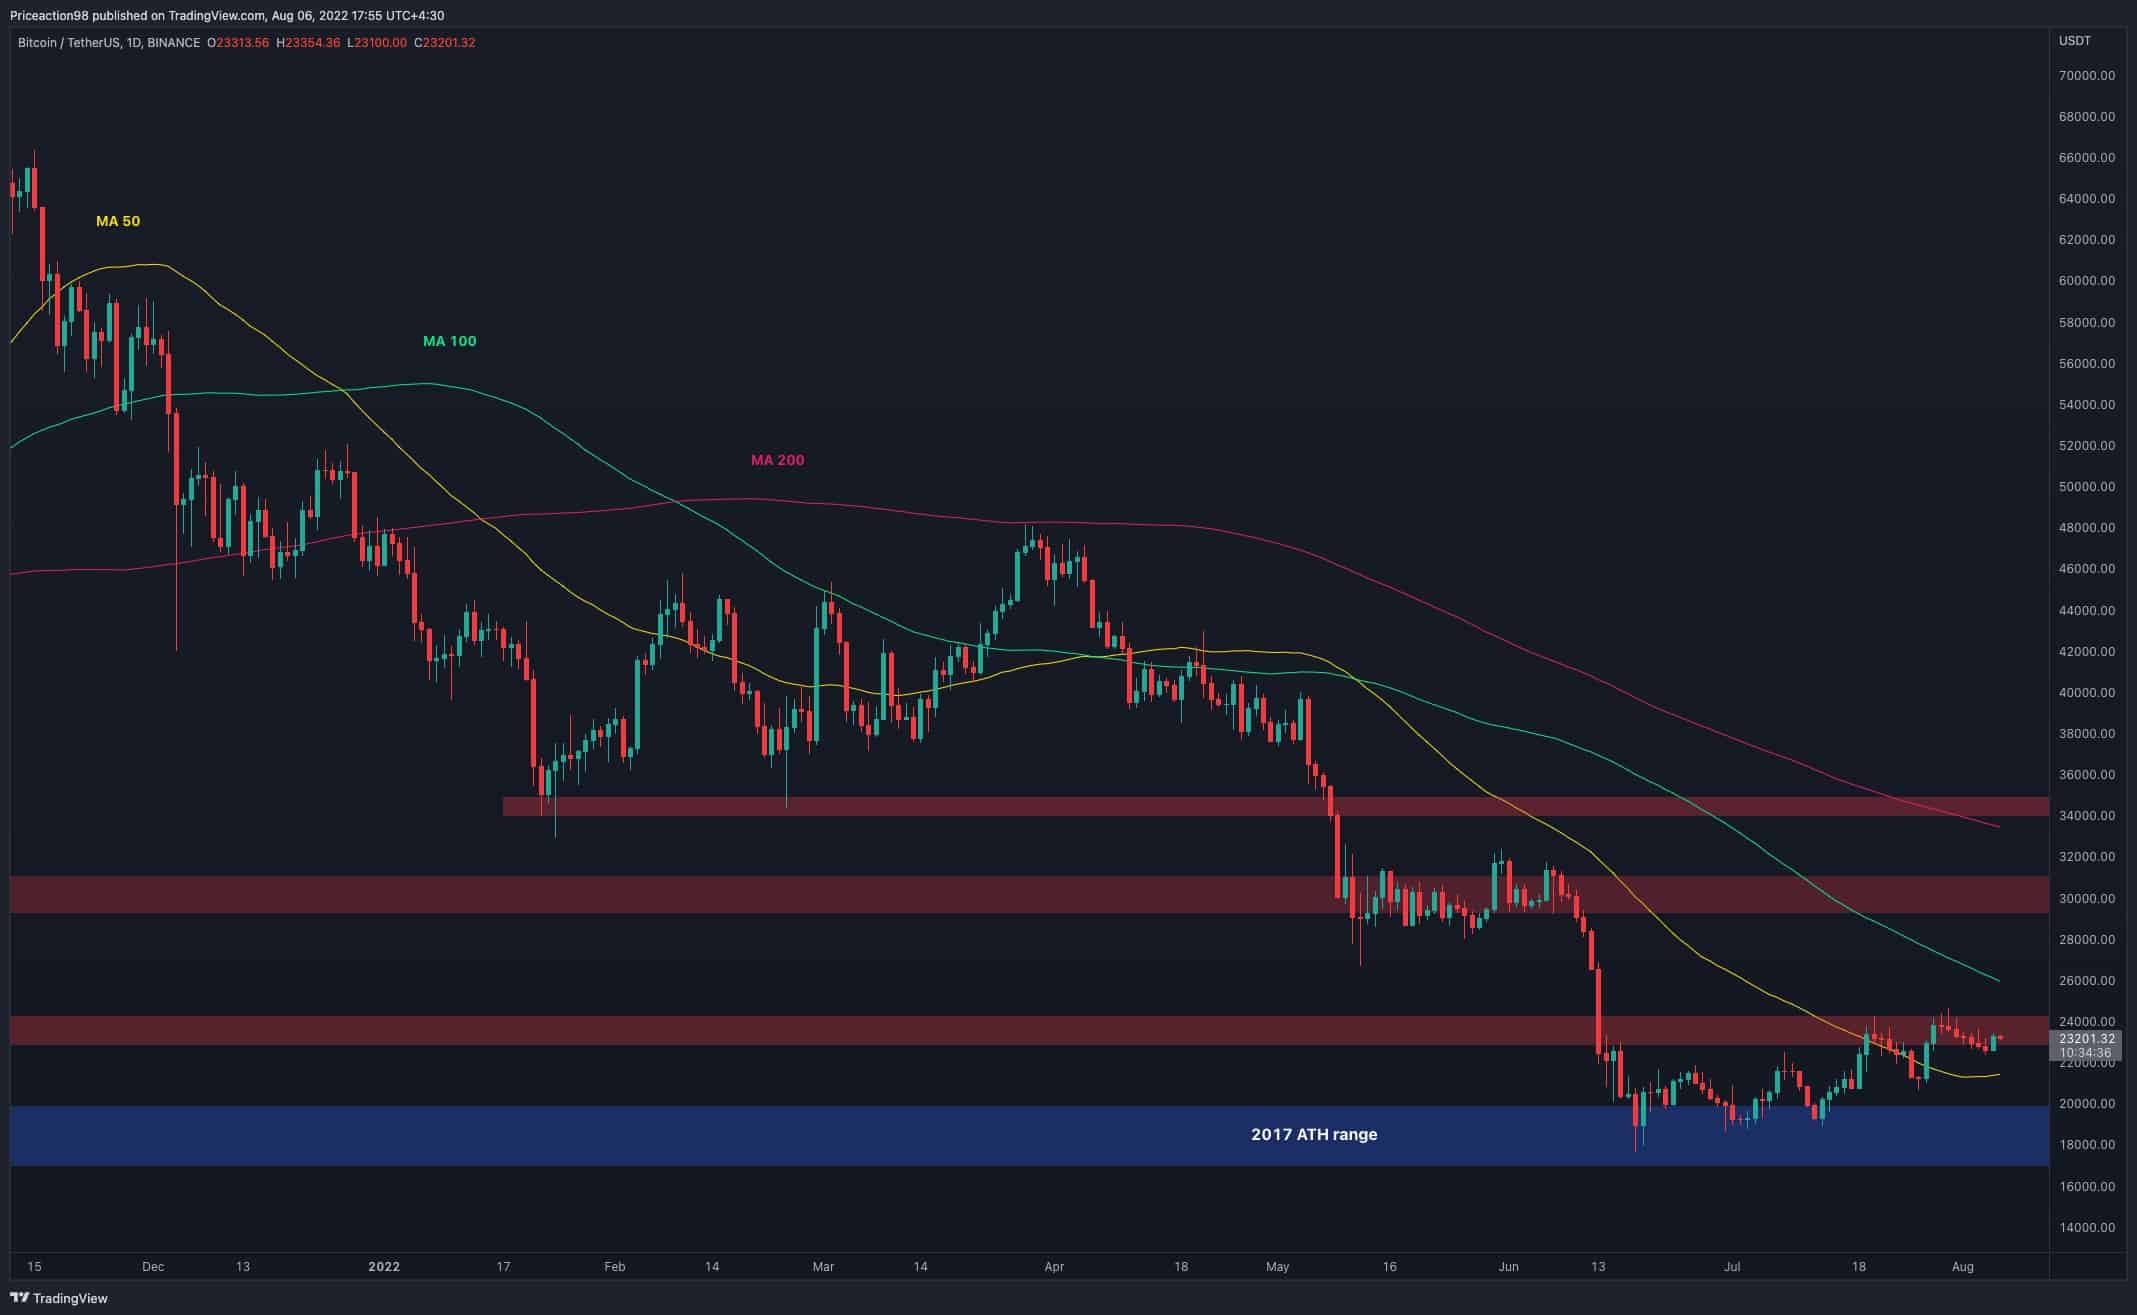
The Daily Chart
Currently, the price action is suggesting that Bitcoin may finally surpass this significant level to the upside, which could pave the way for a rally towards the $30K supply zone. The 100-day moving average is currently at the $26K mark, and it’s likely to provide some resistance. Conversely, in case of a bearish pullback, the 50-day moving average – currently sitting at $21K – will likely act as support.
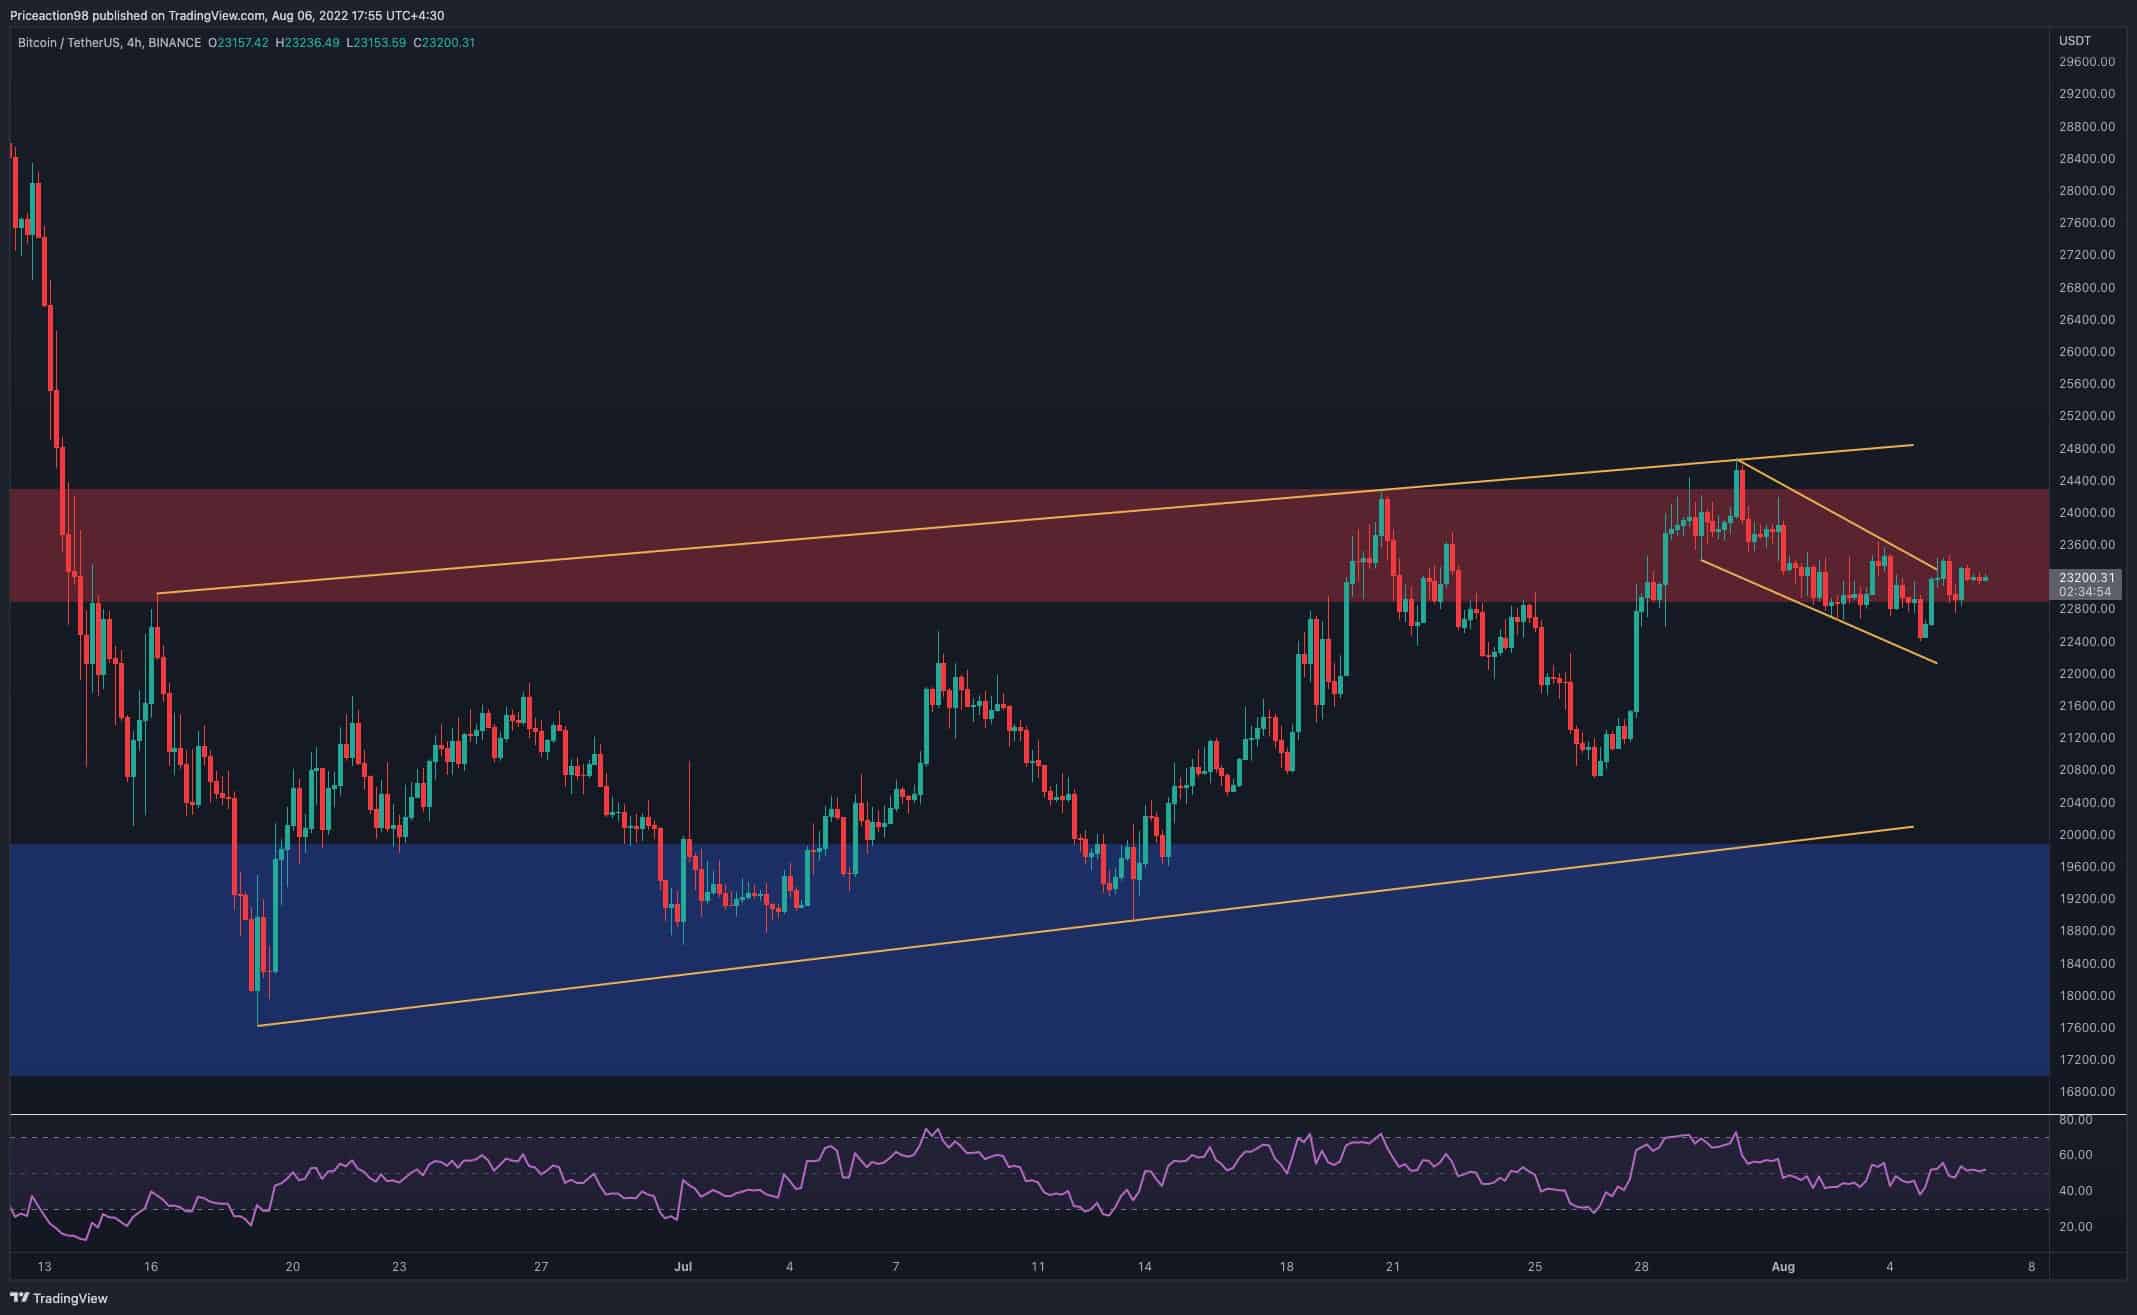
The 4-Hour Chart
On the 4-hour timeframe, the price continues trying to push the bearish flag pattern to the upside, after getting rejected to the downside for the third time. However, a smaller bullish flag pattern seems to be forming and the price is currently surmounting it. Flags are continuation patterns and a bullish breakout from the bull flag could initiate another rally towards the higher trendline of the larger pattern.
The price will potentially break above it. Additionally, the RSI indicator is still oscillating around the 50% figure. This indicates that neither the bears nor the bulls are in control and the momentum is in a state of equilibrium. The outlook is likely to change after the weekend.
Onchain Analysis
By Shayan
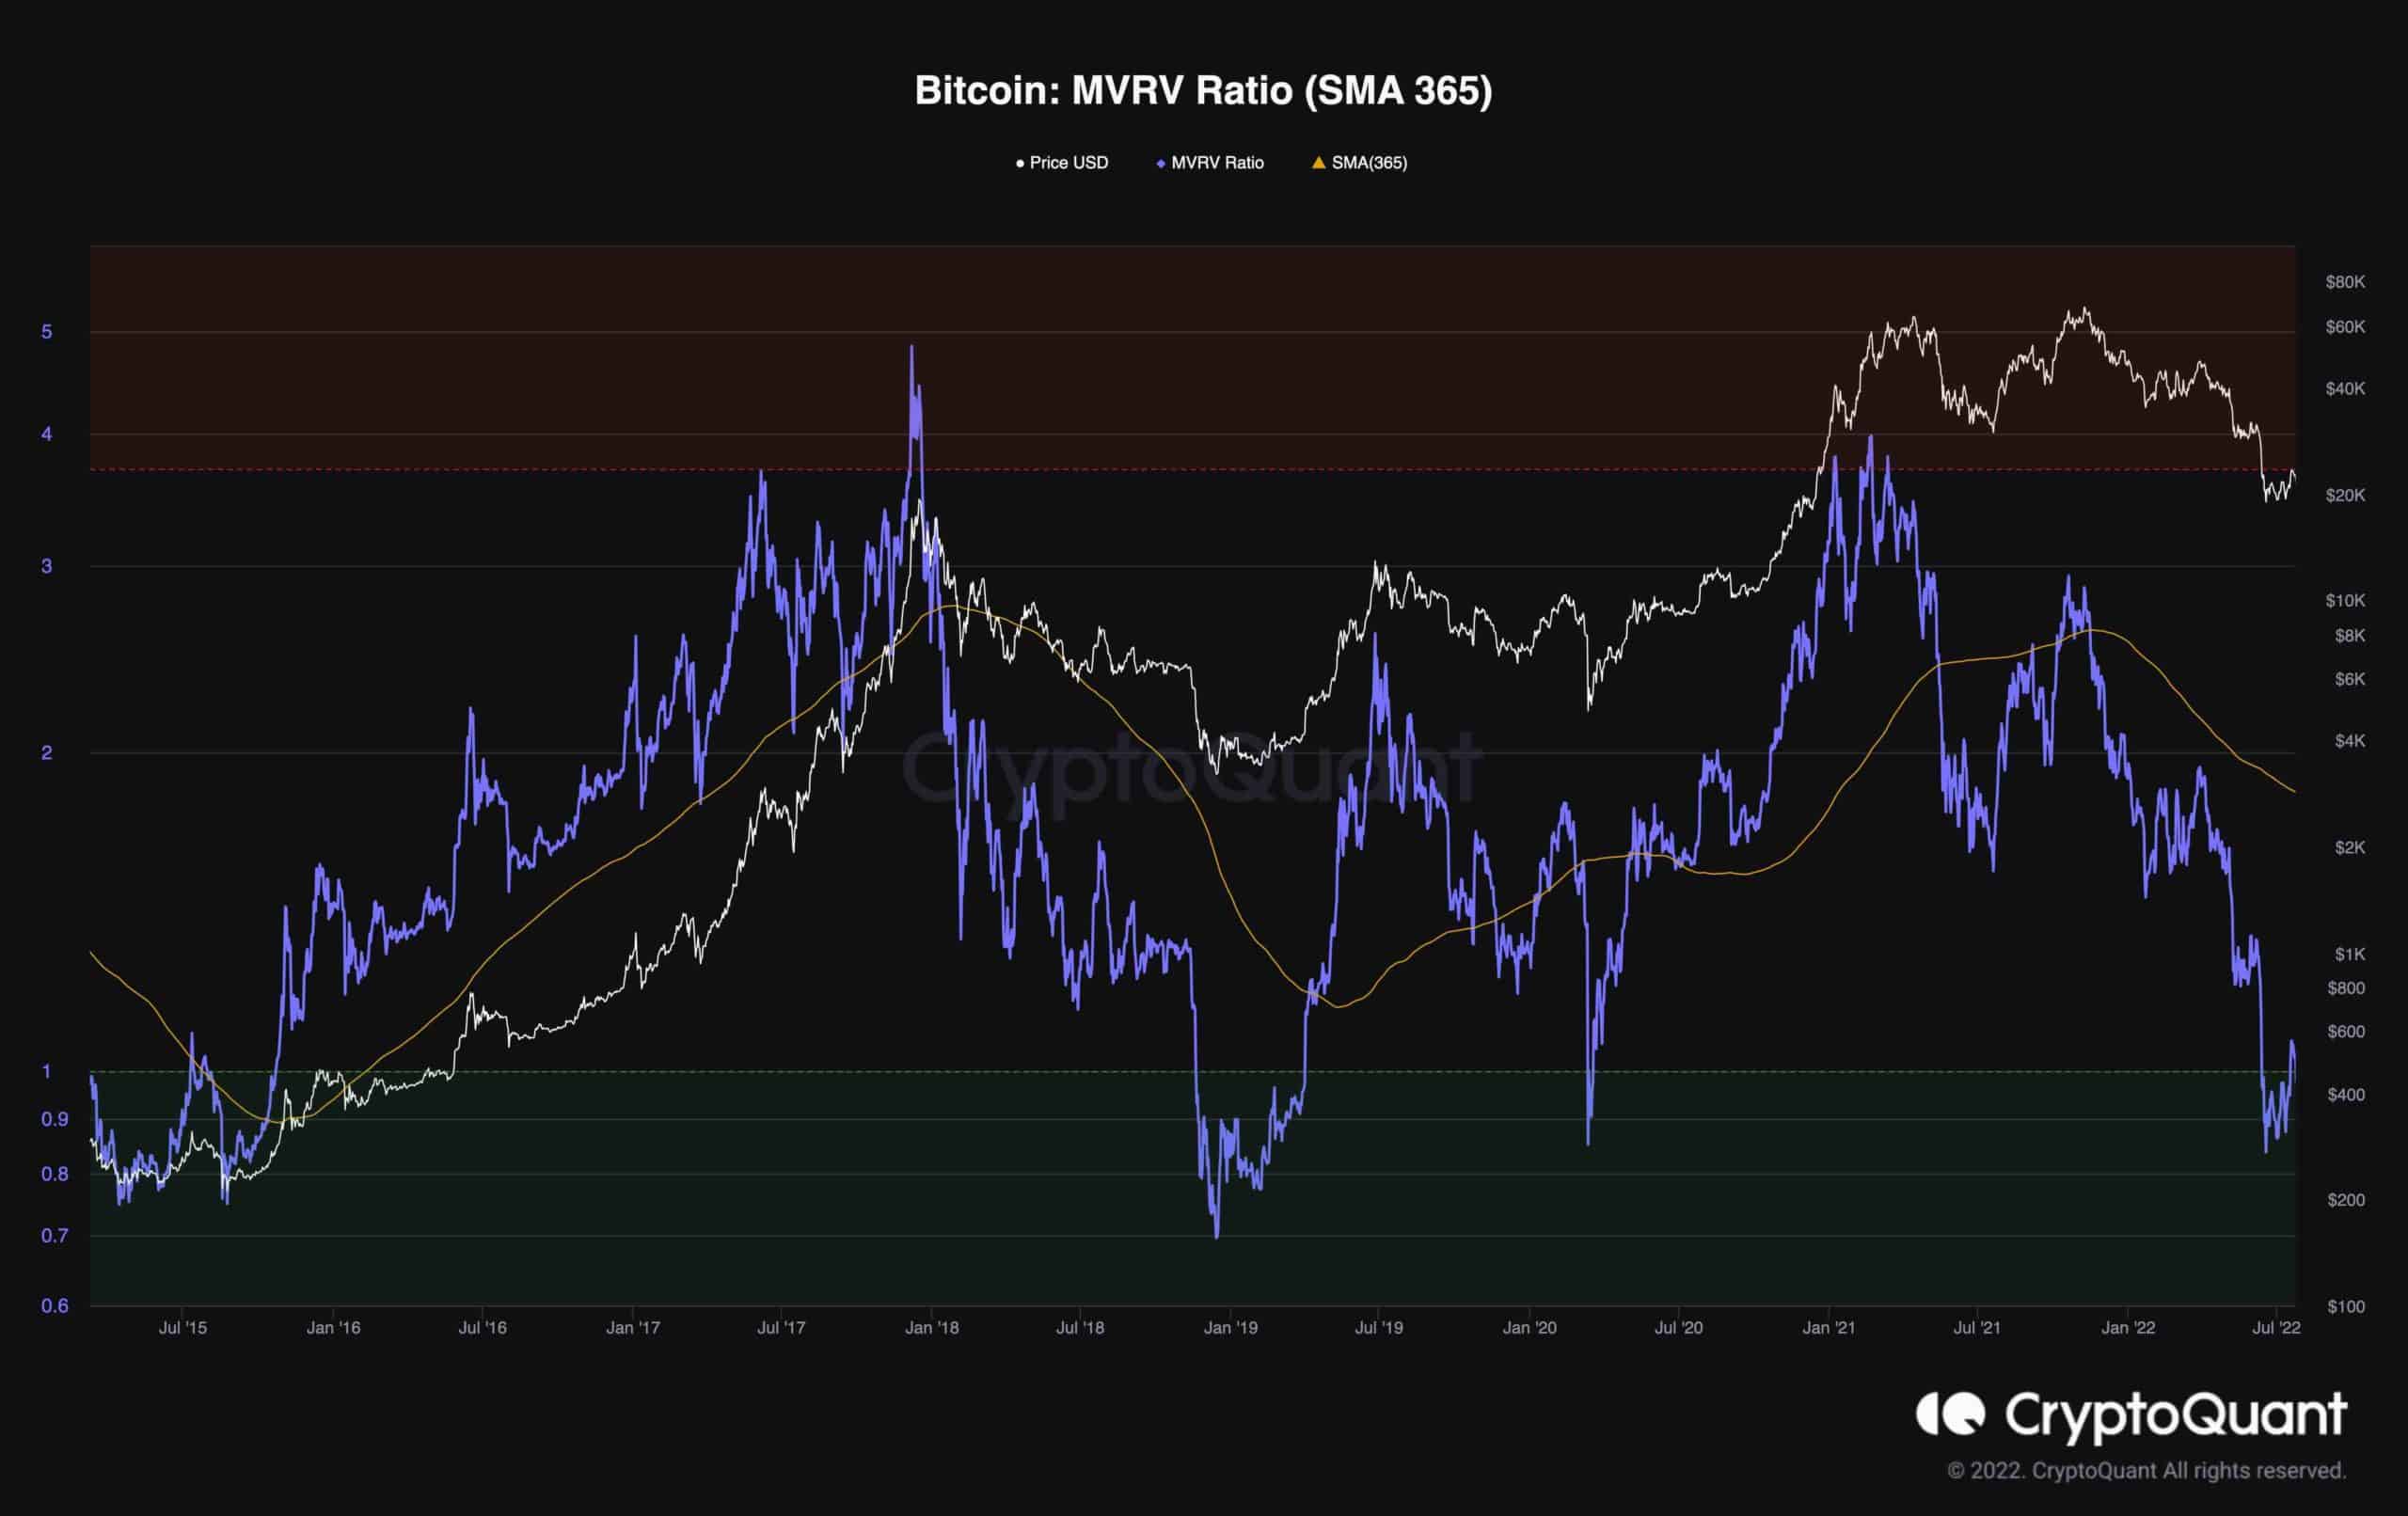
The market appears to be looking for direction, but the big players are standing still. Following last weeks Powell’s speech and the Fed’s decision to raise interest rates, Bitcoin’s price soared beyond its “Realized Price,” a crucial threshold for the price to hold.
Consequently, to cross the Realized Price level again, a larger volume and tremendous selling pressure are required. The MVRV indicator makes it easier to track Bitcoin’s price in relation to its realized value. It shows how the cryptocurrency surged last week from the undervalued zone. However, despite a rapid surge from the indicated area, the 365-day moving average still shows room for another substantial shakeout based on previous cycles.
Therefore, before the major bull run, another leg down will be probable given the market’s current confusion and uncertainty as well as the current state of recession in the global economy.