Bitcoin ETFs Smash $10B Trading Volume Record Amid Wild BTC Price Action
/arc-photo-coindesk/arc2-prod/public/LXF2COBSKBCNHNRE3WTK2BZ7GE.png)
-
U.S.-listed spot bitcoin ETFs had their busiest day ever on Tuesday, surpassing $10 billion in trading volume as BTC’s new all-time high turned into a correction.
-
BlackRock’s IBIT was the fourth most traded among all ETFs with $3.8 billion volume, Barchart data shows.
-
“These are bananas numbers for ETFs under 2 months old,” one analyst noted.
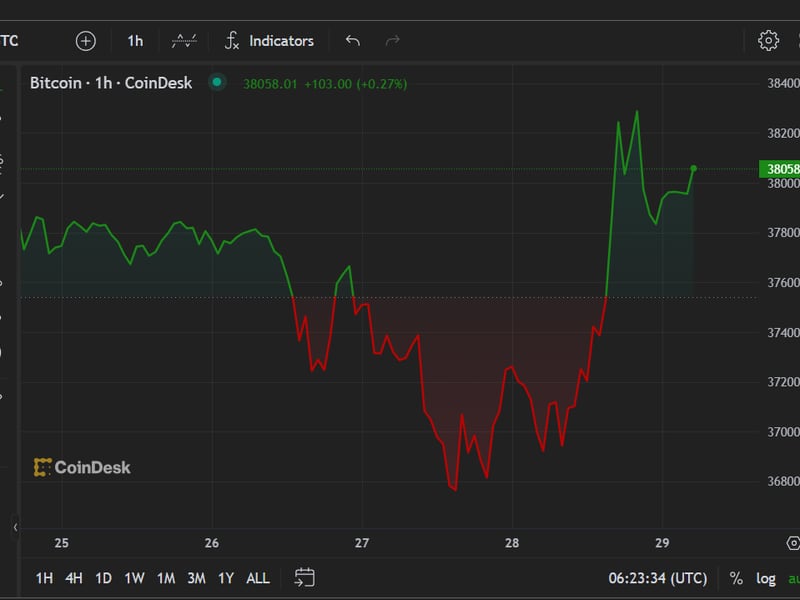
U.S.-listed spot bitcoin ETFs had their busiest day ever on Tuesday as bitcoin’s (BTC) run for all-time high price turned into a bloodbath, the price tumbling more than 10% after hitting a record above $69,000.
The ten ETFs topped $10 billion in trading volume during the session, breaking last week’s daily record, according to Bloomberg data compiled by Eric Balchunas, ETF analyst at Bloomberg Intelligence. BlackRock’s IBIT, Fidelity’s FBTC, Bitwise’s BITB and ARKB, co-managed by Ark Invest and 21Shares, all broke their personal volume records, Balchunas noted.
BlackRock’s IBIT was the fourth most traded among all ETFs, notching over $3.8 billion in volume, Barchart data shows.
“These are bananas numbers for ETFs under 2 months old,” said Balchunas. Spot Bitcoin ETFs started trading on Jan. 11 in the U.S.
Last week, heavy bitcoin ETF trading was the result of strong net inflows, with the funds attracting over $1.7 billion in fresh money. Today’s action, however, may indicate heavy profit-taking, with traders either spooked by the heavy volatility, or perhaps deciding to sell ETF shares to lock in bitcoin’s 50% price gain over the past month.
Edited by Stephen Alpher.


