Bitcoin Drops to Historic Trendline but Bullish Signs Flash, Reversal Inbound? (BTC Price Analysis)
Bitcoin has been experiencing a prolonged bear market since the all-time high of $69K in November 2021. The past 24 hours have also proven to be quite a challenge for the cryptocurrency as it dropped below $19,000. Yet, the next few days or possibly weeks are likely to be critical for the mid-term future of BTC’s price.
Technical Analysis
By Shayan
The Weekly Chart
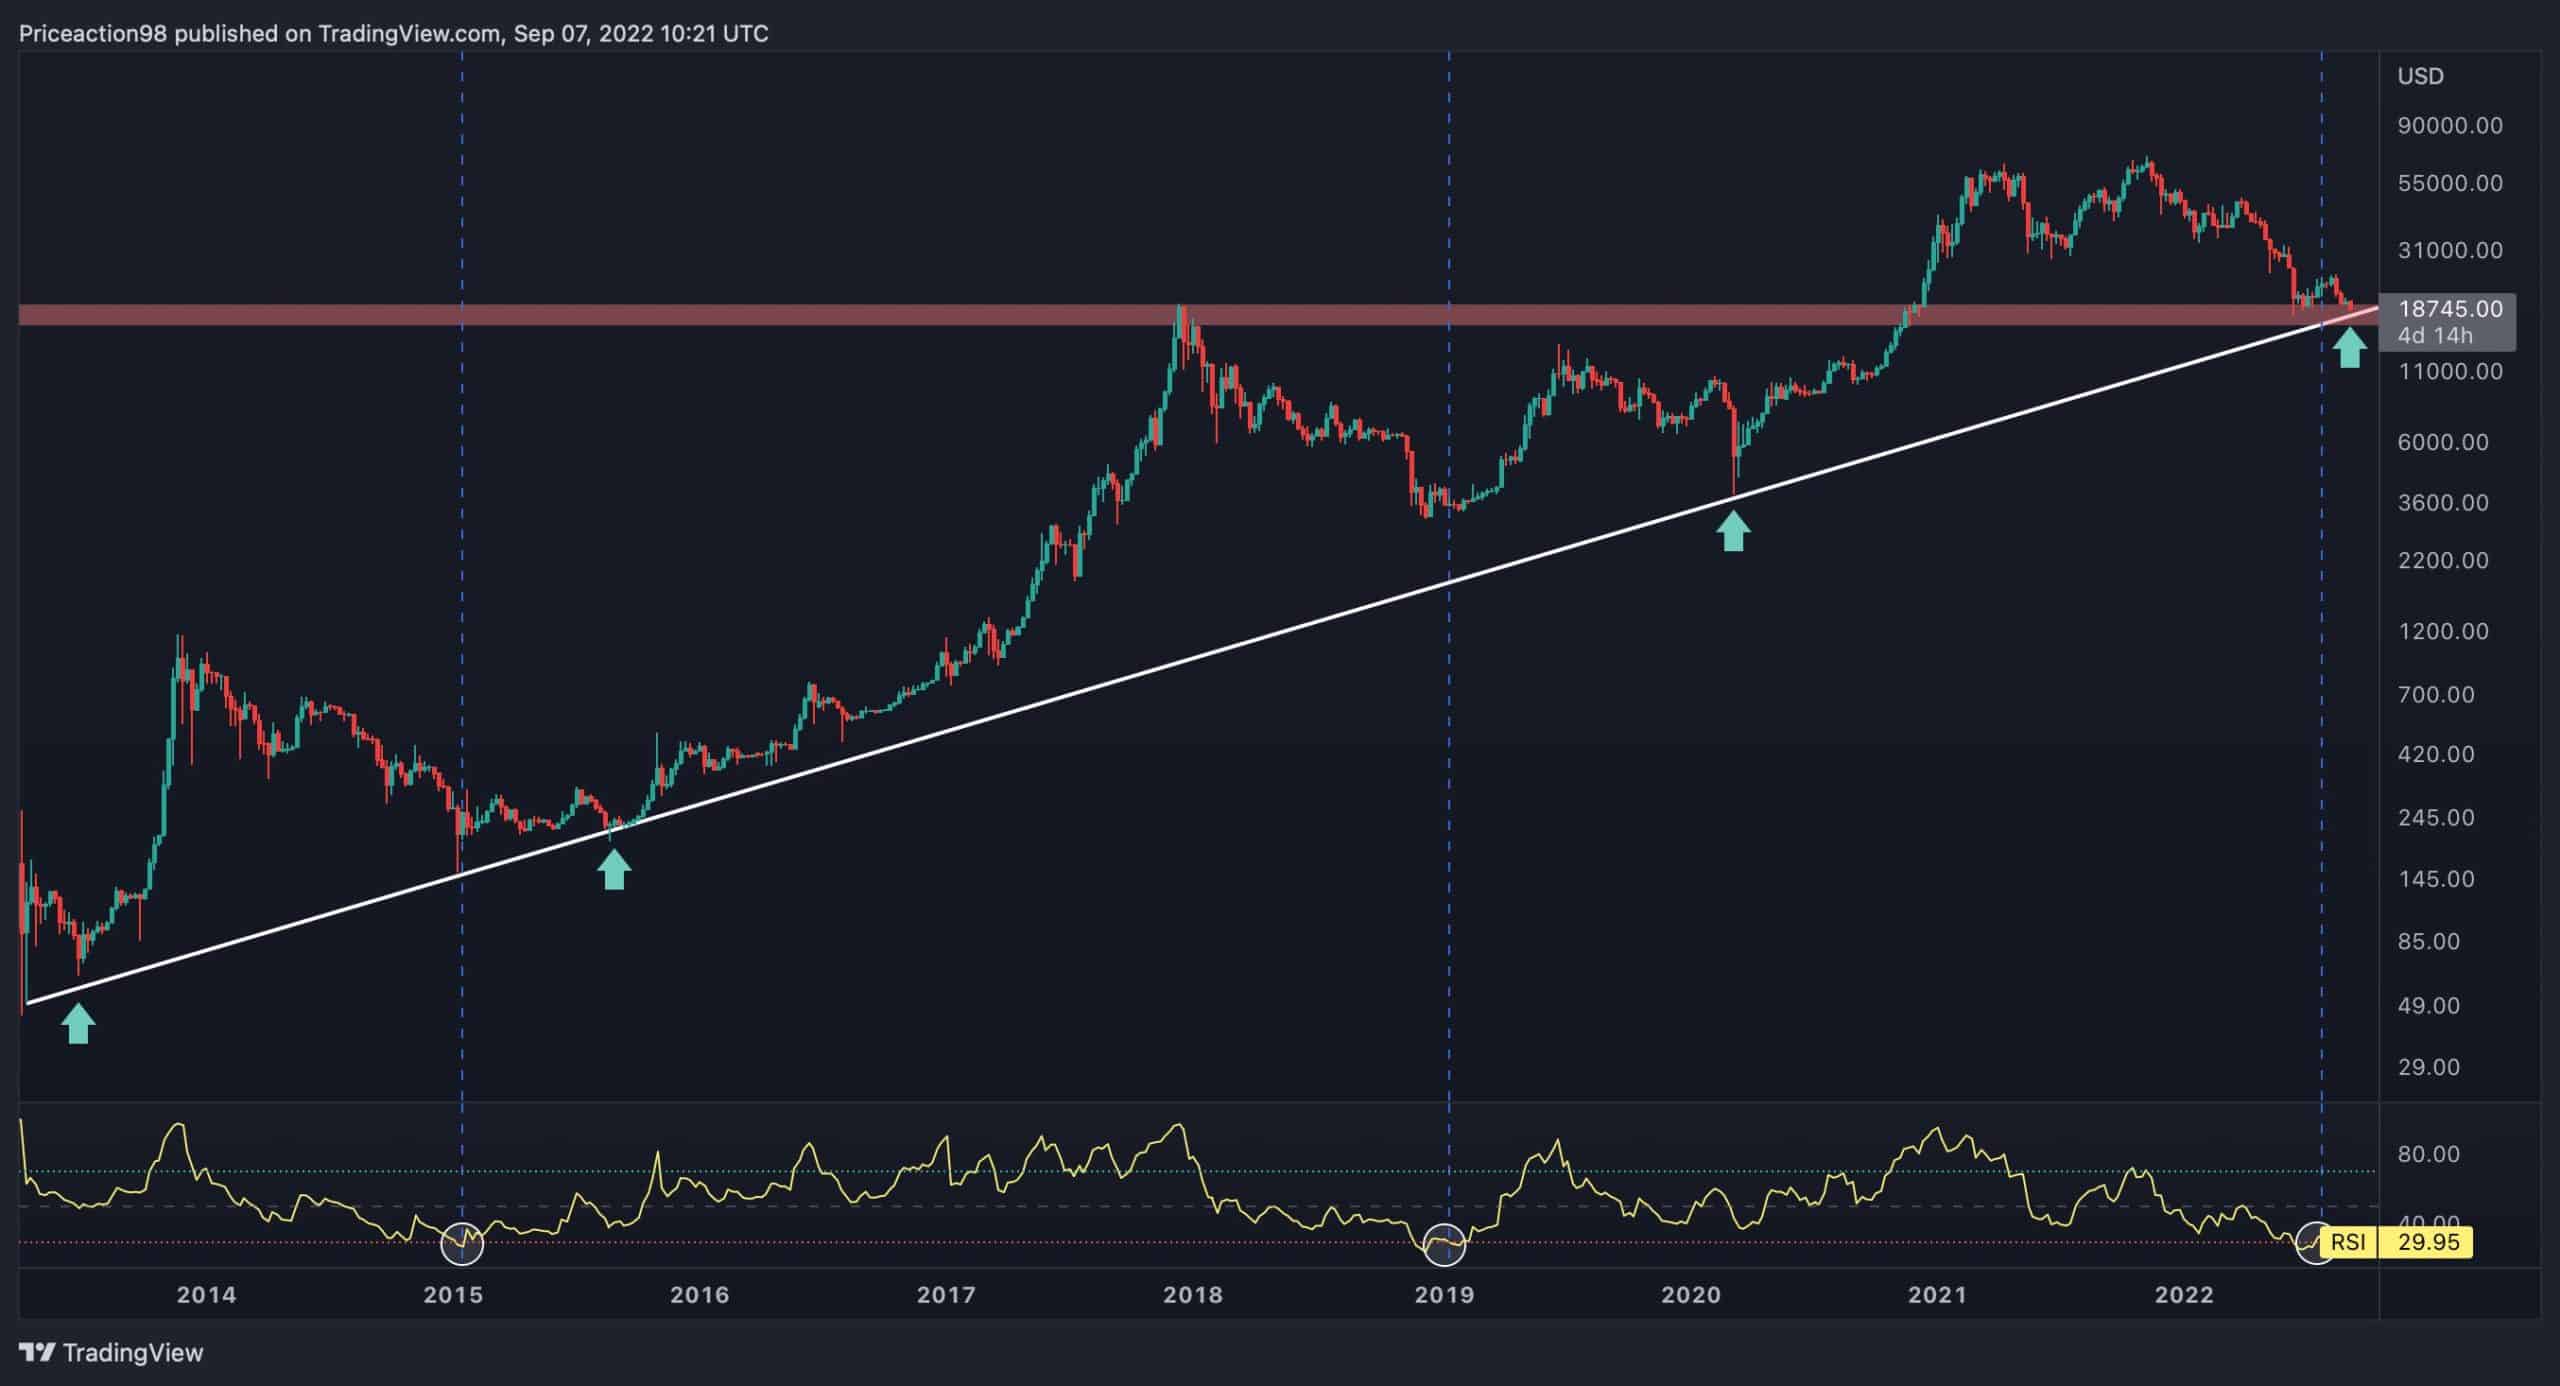
Historically, Bitcoin bear markets have concluded after participants underwent a phase of massive capitulation and distribution of their assets. Additionally, there is an ascending 9+ year trendline on BTC’s chart. This has always supported the price and marked the bear market bottoms.
As the following chart demonstrates, the price has declined to $18K. This level aligns with the above-mentioned support trendline, increasing the possibility of a trend reversal.
Furthermore, the Weekly RSI indicator has dropped to the under-value range due to Bitcoin’s massive shakeout to the $20K region. It’s worth mentioning that bear markets have also typically ended when the Weekly RSI indicator entered this under-value territory.
Overall, if the price drops below the trendline, another decline could be imminent for Bitcoin towards lower price channels.
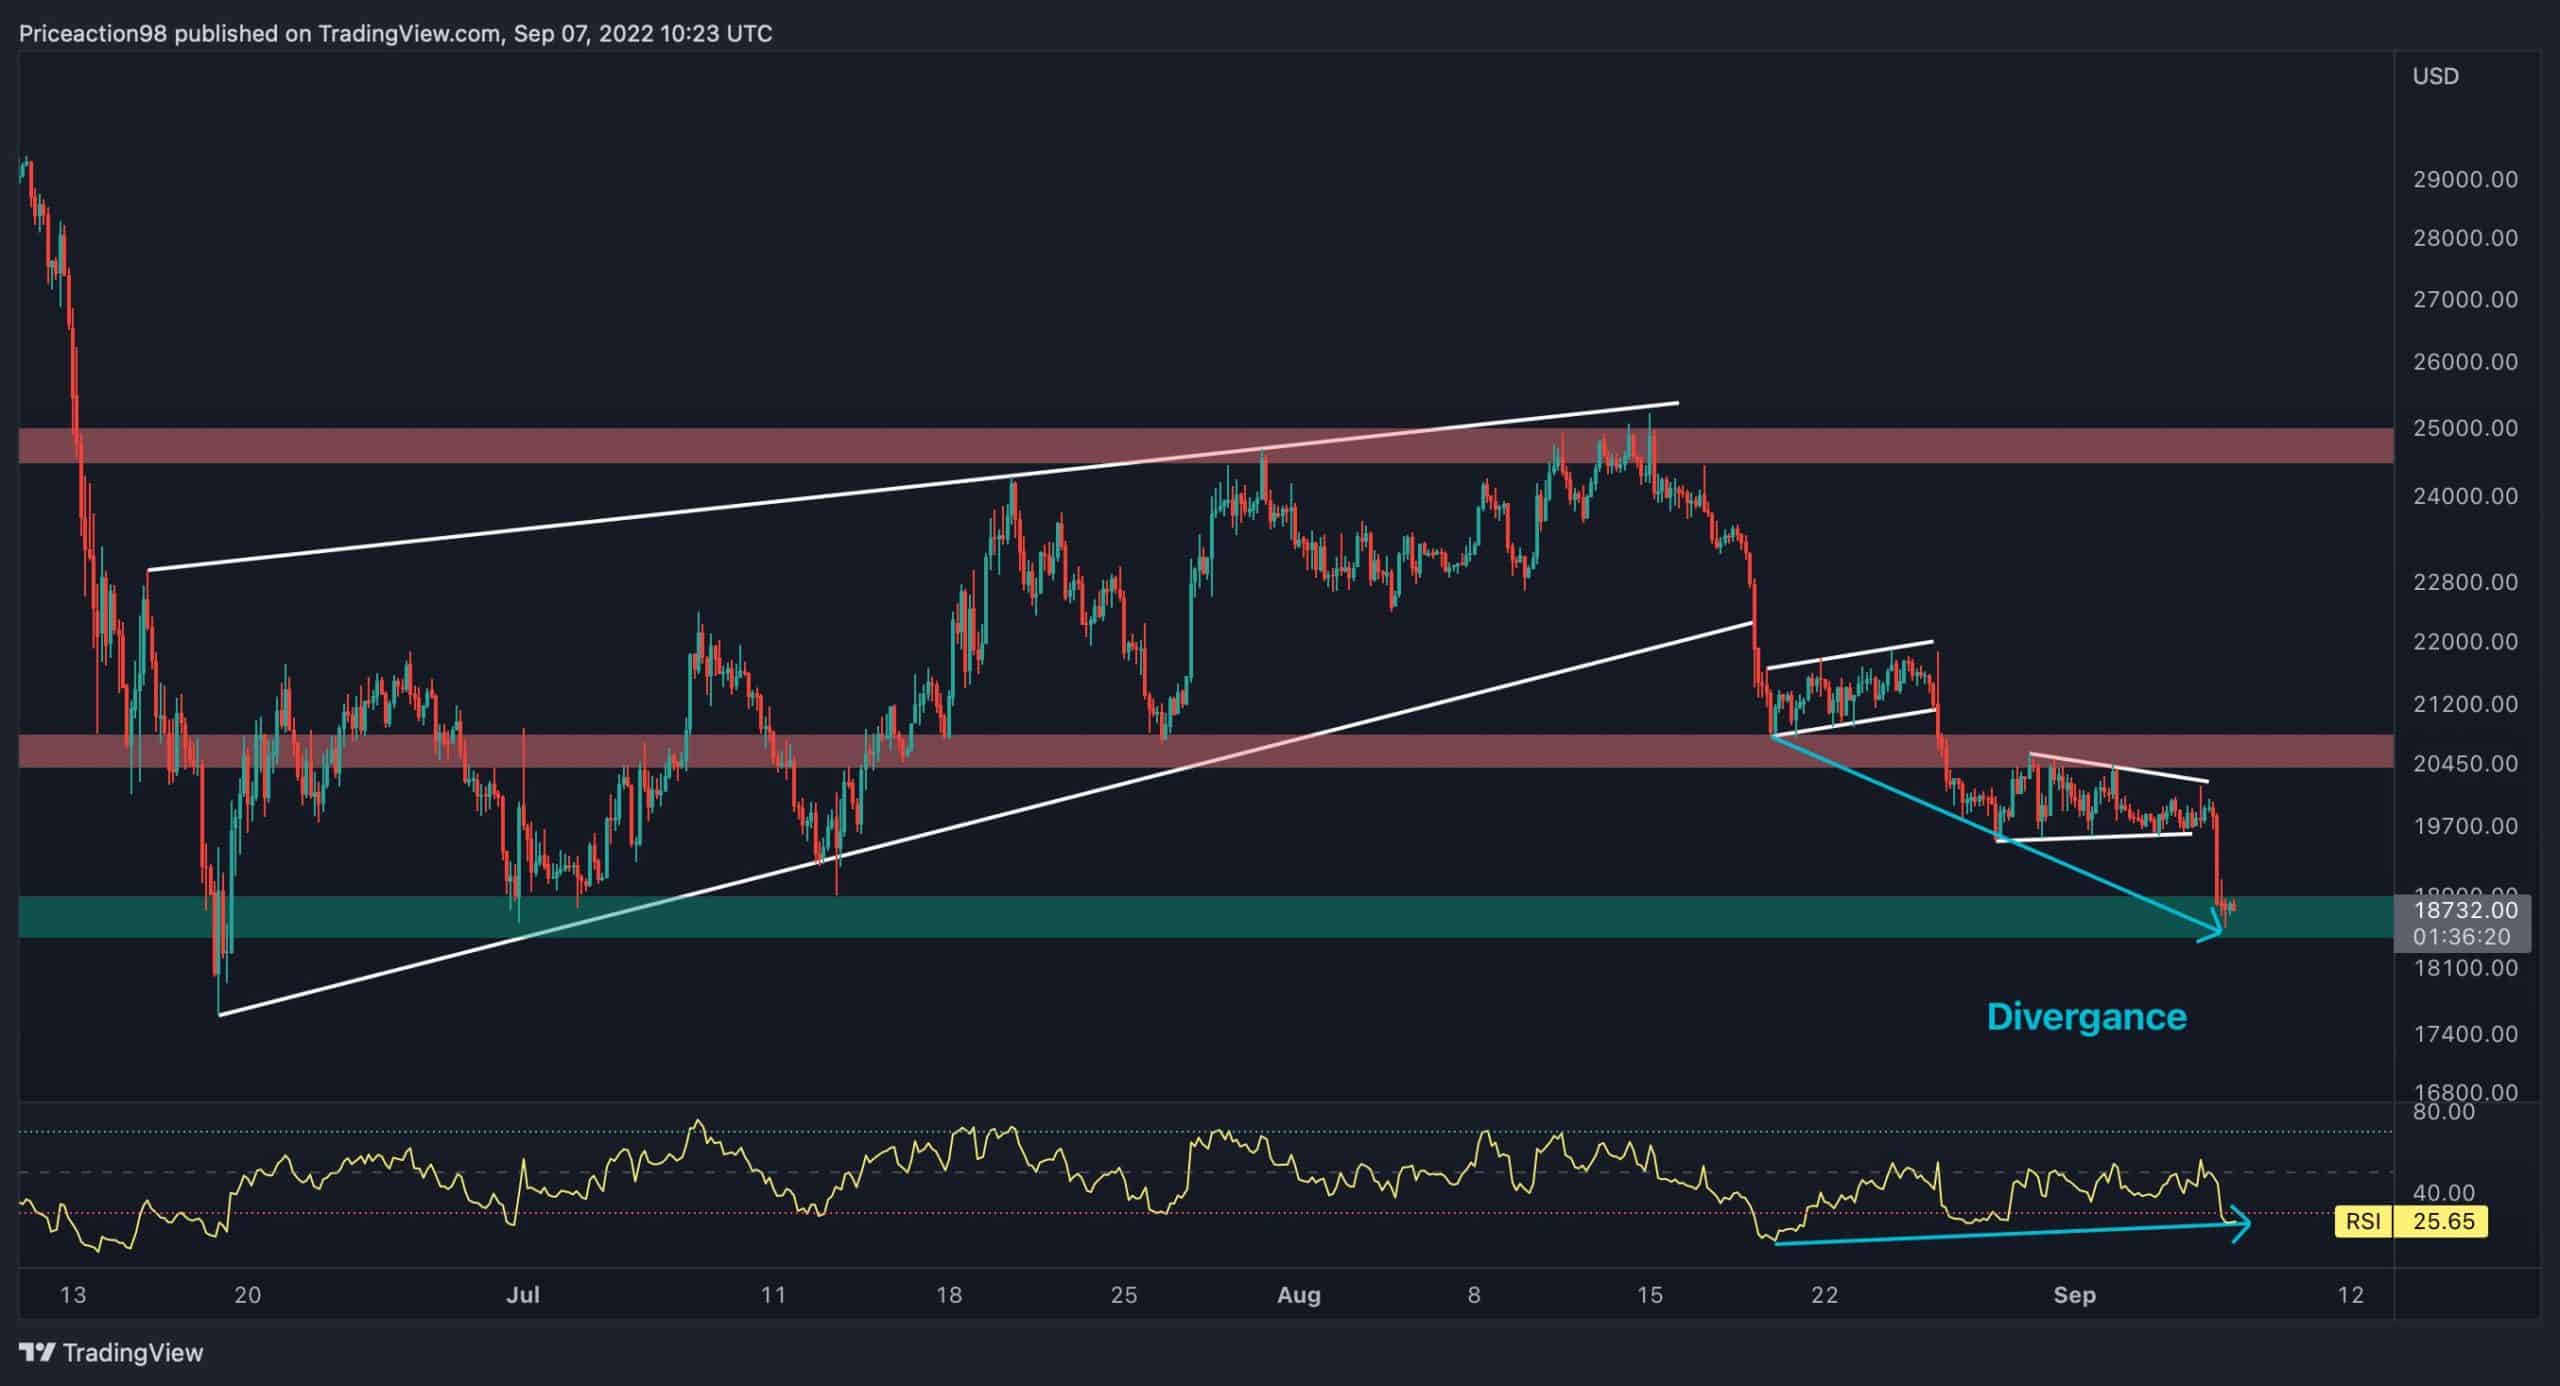
The 4-Hour Chart
On the 4-hour timeframe, after forming the same continuation correction pattern for the third time and consolidating inside, the price finally broke the lower threshold. This resulted in a massive decline to the $18K support level.
This is the most crucial level for the bulls to defend. If the bears successfully push the price below this critical level, another clash for power will likely occur.
However, there is a considerable bullish divergence between the price and the RSI indicator in this timeframe. The formation, alongside the sentimental power of the $18K support level, indicates a potential reversal in the next few days.
The current question is whether the bulls can hold this support for the fourth time. Next week’s price action could be a clue to determining the outcome.
The post Bitcoin Drops to Historic Trendline but Bullish Signs Flash, Reversal Inbound? (BTC Price Analysis) appeared first on CryptoPotato.