Bitcoin Drops $2700 In Hours: BTC Price Analysis & Overview Following The Violent Correction
This was expected. Following the phenomenal week, including the rise from $9000 to almost $14,000 without stopping by, Bitcoin bears stopped the train, at least for now.
In a session of violent drops, Bitcoin marked nearly $11,200 as its current low. Is this a change of momentum? Is the bear market here again? In my opinion, no. Corrections are part of the way up, as mentioned already, especially to do that way healthy.
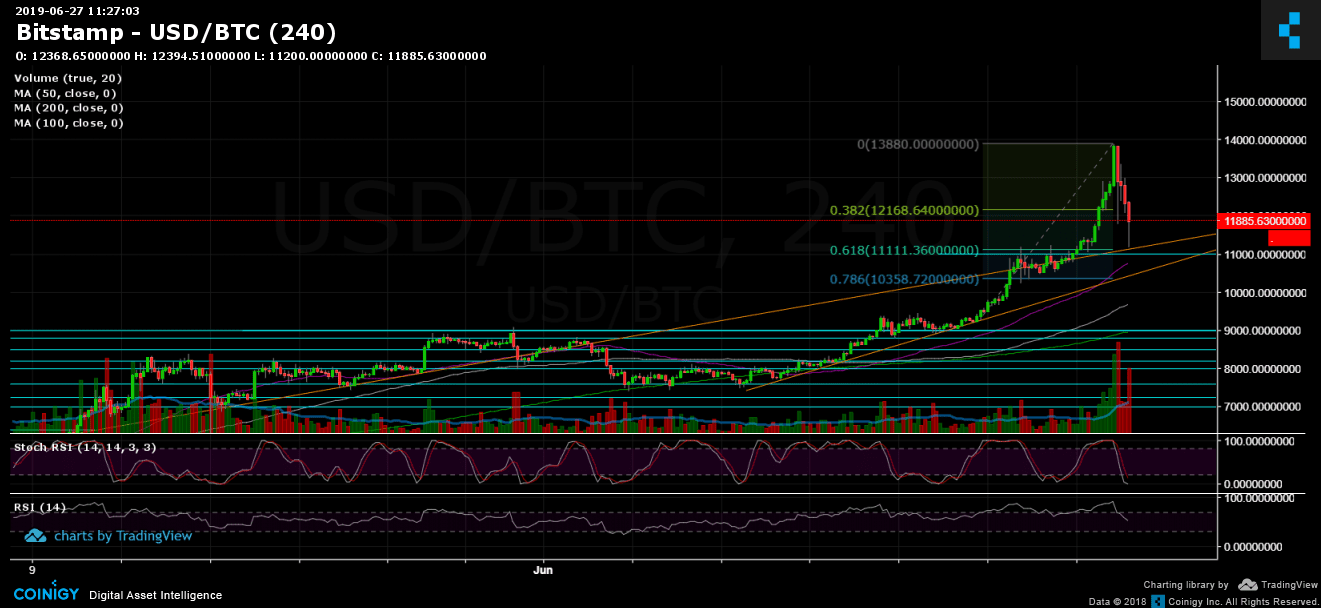
As can be seen on the 4-hour chart, Bitcoin stopped its blood path at the significant 61.8% Fibonacci retracement level, along with the mid-term ascending trend-line (marked in orange). As long as the correction stays there, the bulls can’t complain, in my opinion.
So Far, So Good
– Support/Resistance:
From below, Bitcoin went all the way down to the $11,200 level. Yes, that was the recent resistance/high from days ago. In case Bitcoin breaks further down, the bears should expect to see it retesting the $10,600 support level, before reaching the $10,000 that was easily and quickly broken up. Further below is $9,800 and $9,400.
From above, Bitcoin now faces again the $12,000 – $12,170 area (38.2% Fib retracement level) as the closest resistance zone. The next level is around $12,500 before reaching the $13,000 zone. Breaking the recent 2019 high at $13,880 (along with the $14,000 area) would likely to send Bitcoin to the $15,000 zone since there is not much resistance along the way, including the next targets at $16,400 – $16,650, $17,400 (January 7, 2018, high), $18,000, $19,300 and $20,000 – the current all-time high from December 2017.
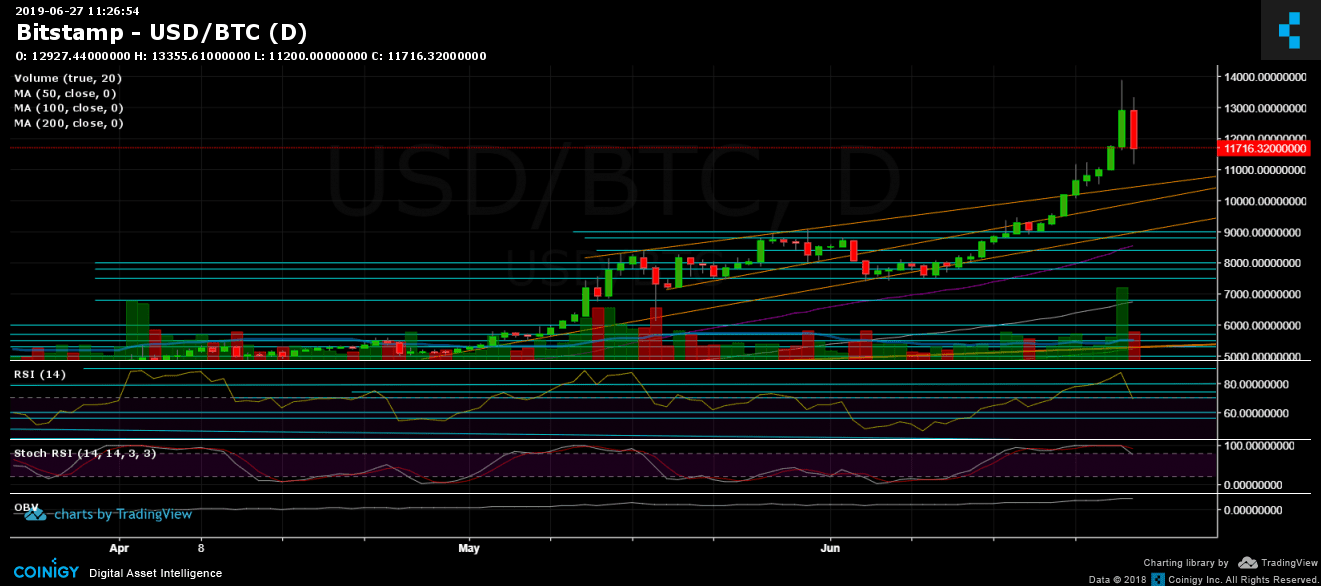
– Daily chart’s RSI: After reaching the overbought area and the mentioned resistance from yesterday at the 88 – 90 RSI area, then the correction came, and the RSI dropped sharply to the 68 support area, still on the bullish side. Every time Bitcoin reaches that RSI levels, a severe correction takes place.
– Trading Volume: This was probably one of the most significant volume days for Bitcoin. BitMEX, which is leading the Bitcoin margin trading volume chart for Bitcoin, saw its all-time high volume day.
– BitFinex open short positions: After the short climbed to monthly high at 29.7K BTC open positions, the correction in Bitcoin reduced the number a bit to a current high of 29.2K BTC.
BTC/USD BitStamp 1-Week Chart
BTC/USD BitStamp 1-Day Chart
The post Bitcoin Drops $2700 In Hours: BTC Price Analysis & Overview Following The Violent Correction appeared first on CryptoPotato.