Bitcoin Dilemma: $25K or $30K Coming First? (BTC Price Analysis)
Bitcoin’s price has recently rebounded from $25K support, but it is currently facing rejection from a key resistance zone.
Technical Analysis
By Edris
The Daily Chart
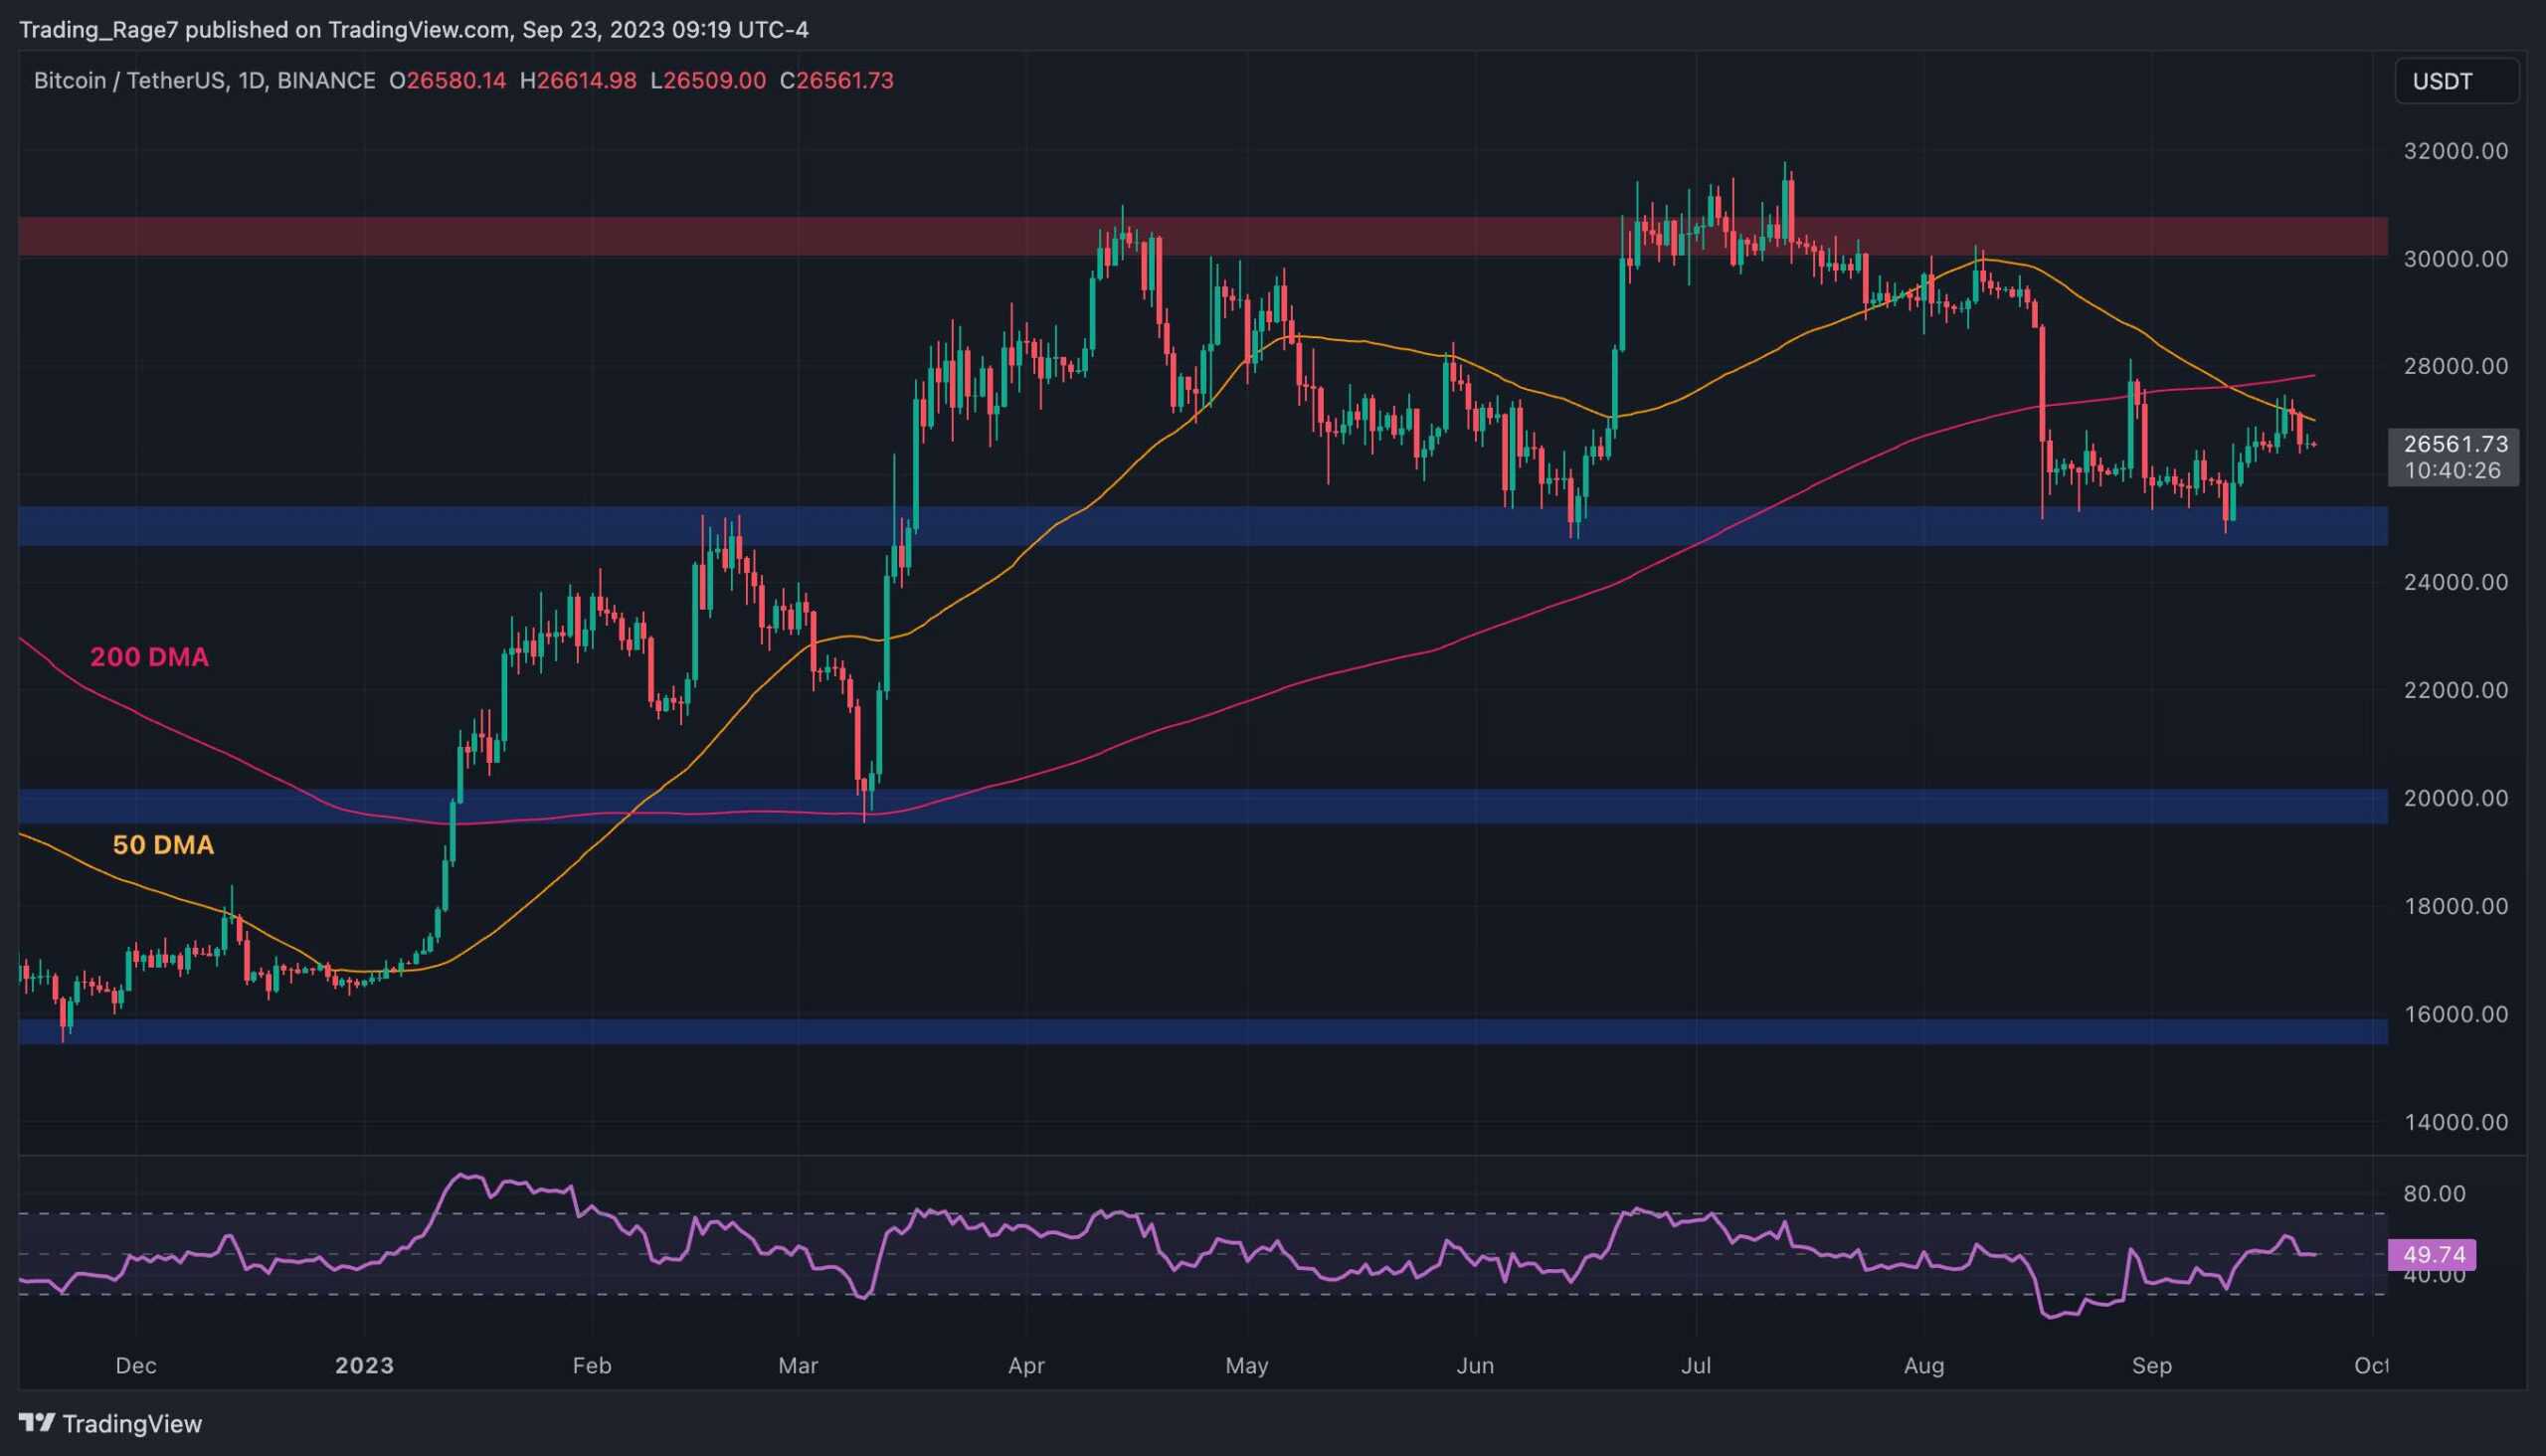
On the daily timeframe, the price has been rising after finding support near $25K. However, the 50-day moving average, around $27K, is pushing the price down. Another significant resistance level is the 200-day MA, trending near $28K.
The price must overcome this resistance to retest the $30K level. Conversely, if BTC fails to maintain its bullish momentum and falls below $25K, the market will likely decline towards the $20K area.
The 4-Hour Chart
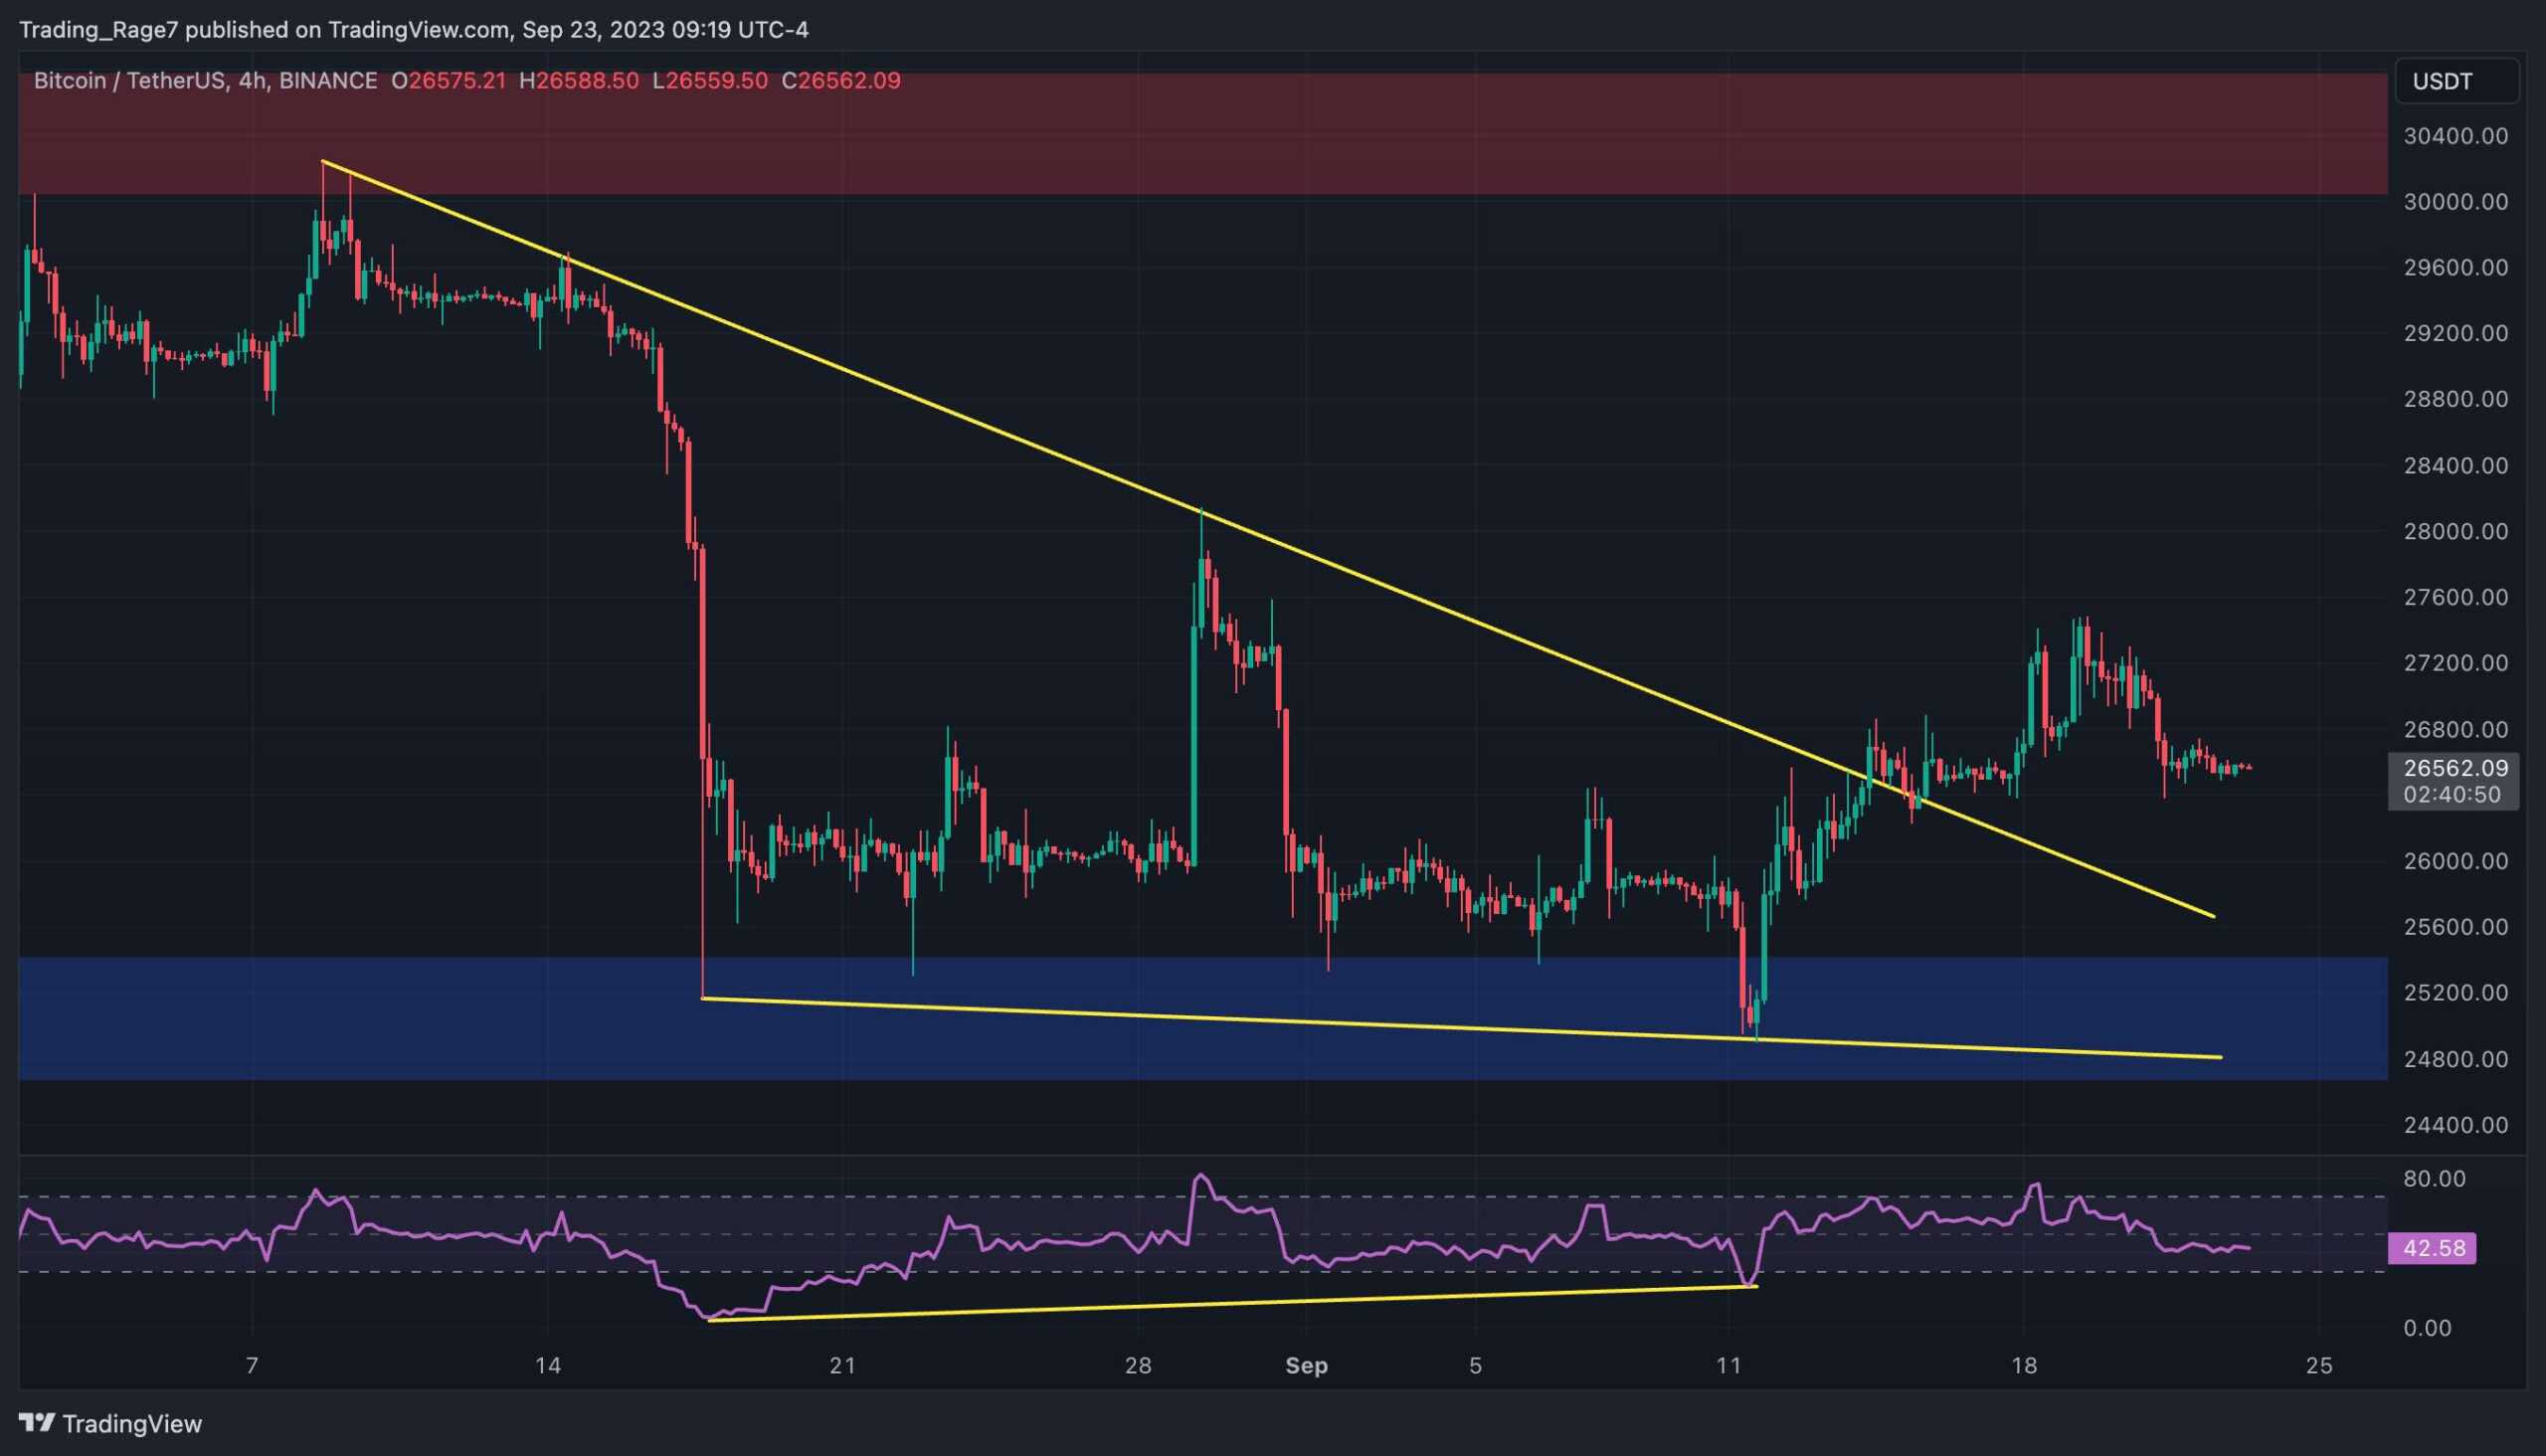
In the short term, the 4-hour chart suggests a bullish outlook. The price has broken above a large falling wedge pattern, a classic bullish reversal signal. From a classical PA perspective, BTC’s price is expected to rise again toward the $30K resistance level.
This would be a strong bullish signal, as the probability of a breakout would likely be significantly higher this time. However, the price needs to complete a pullback before rallying higher.
Onchain Analysis
By Shayan
Bitcoin’s price has experienced a significant downtrend in the past few months, falling below the 100-day and 200-day moving averages. This decline has raised speculation about Bitcoin’s ability to break through the critical support at $25K successfully.
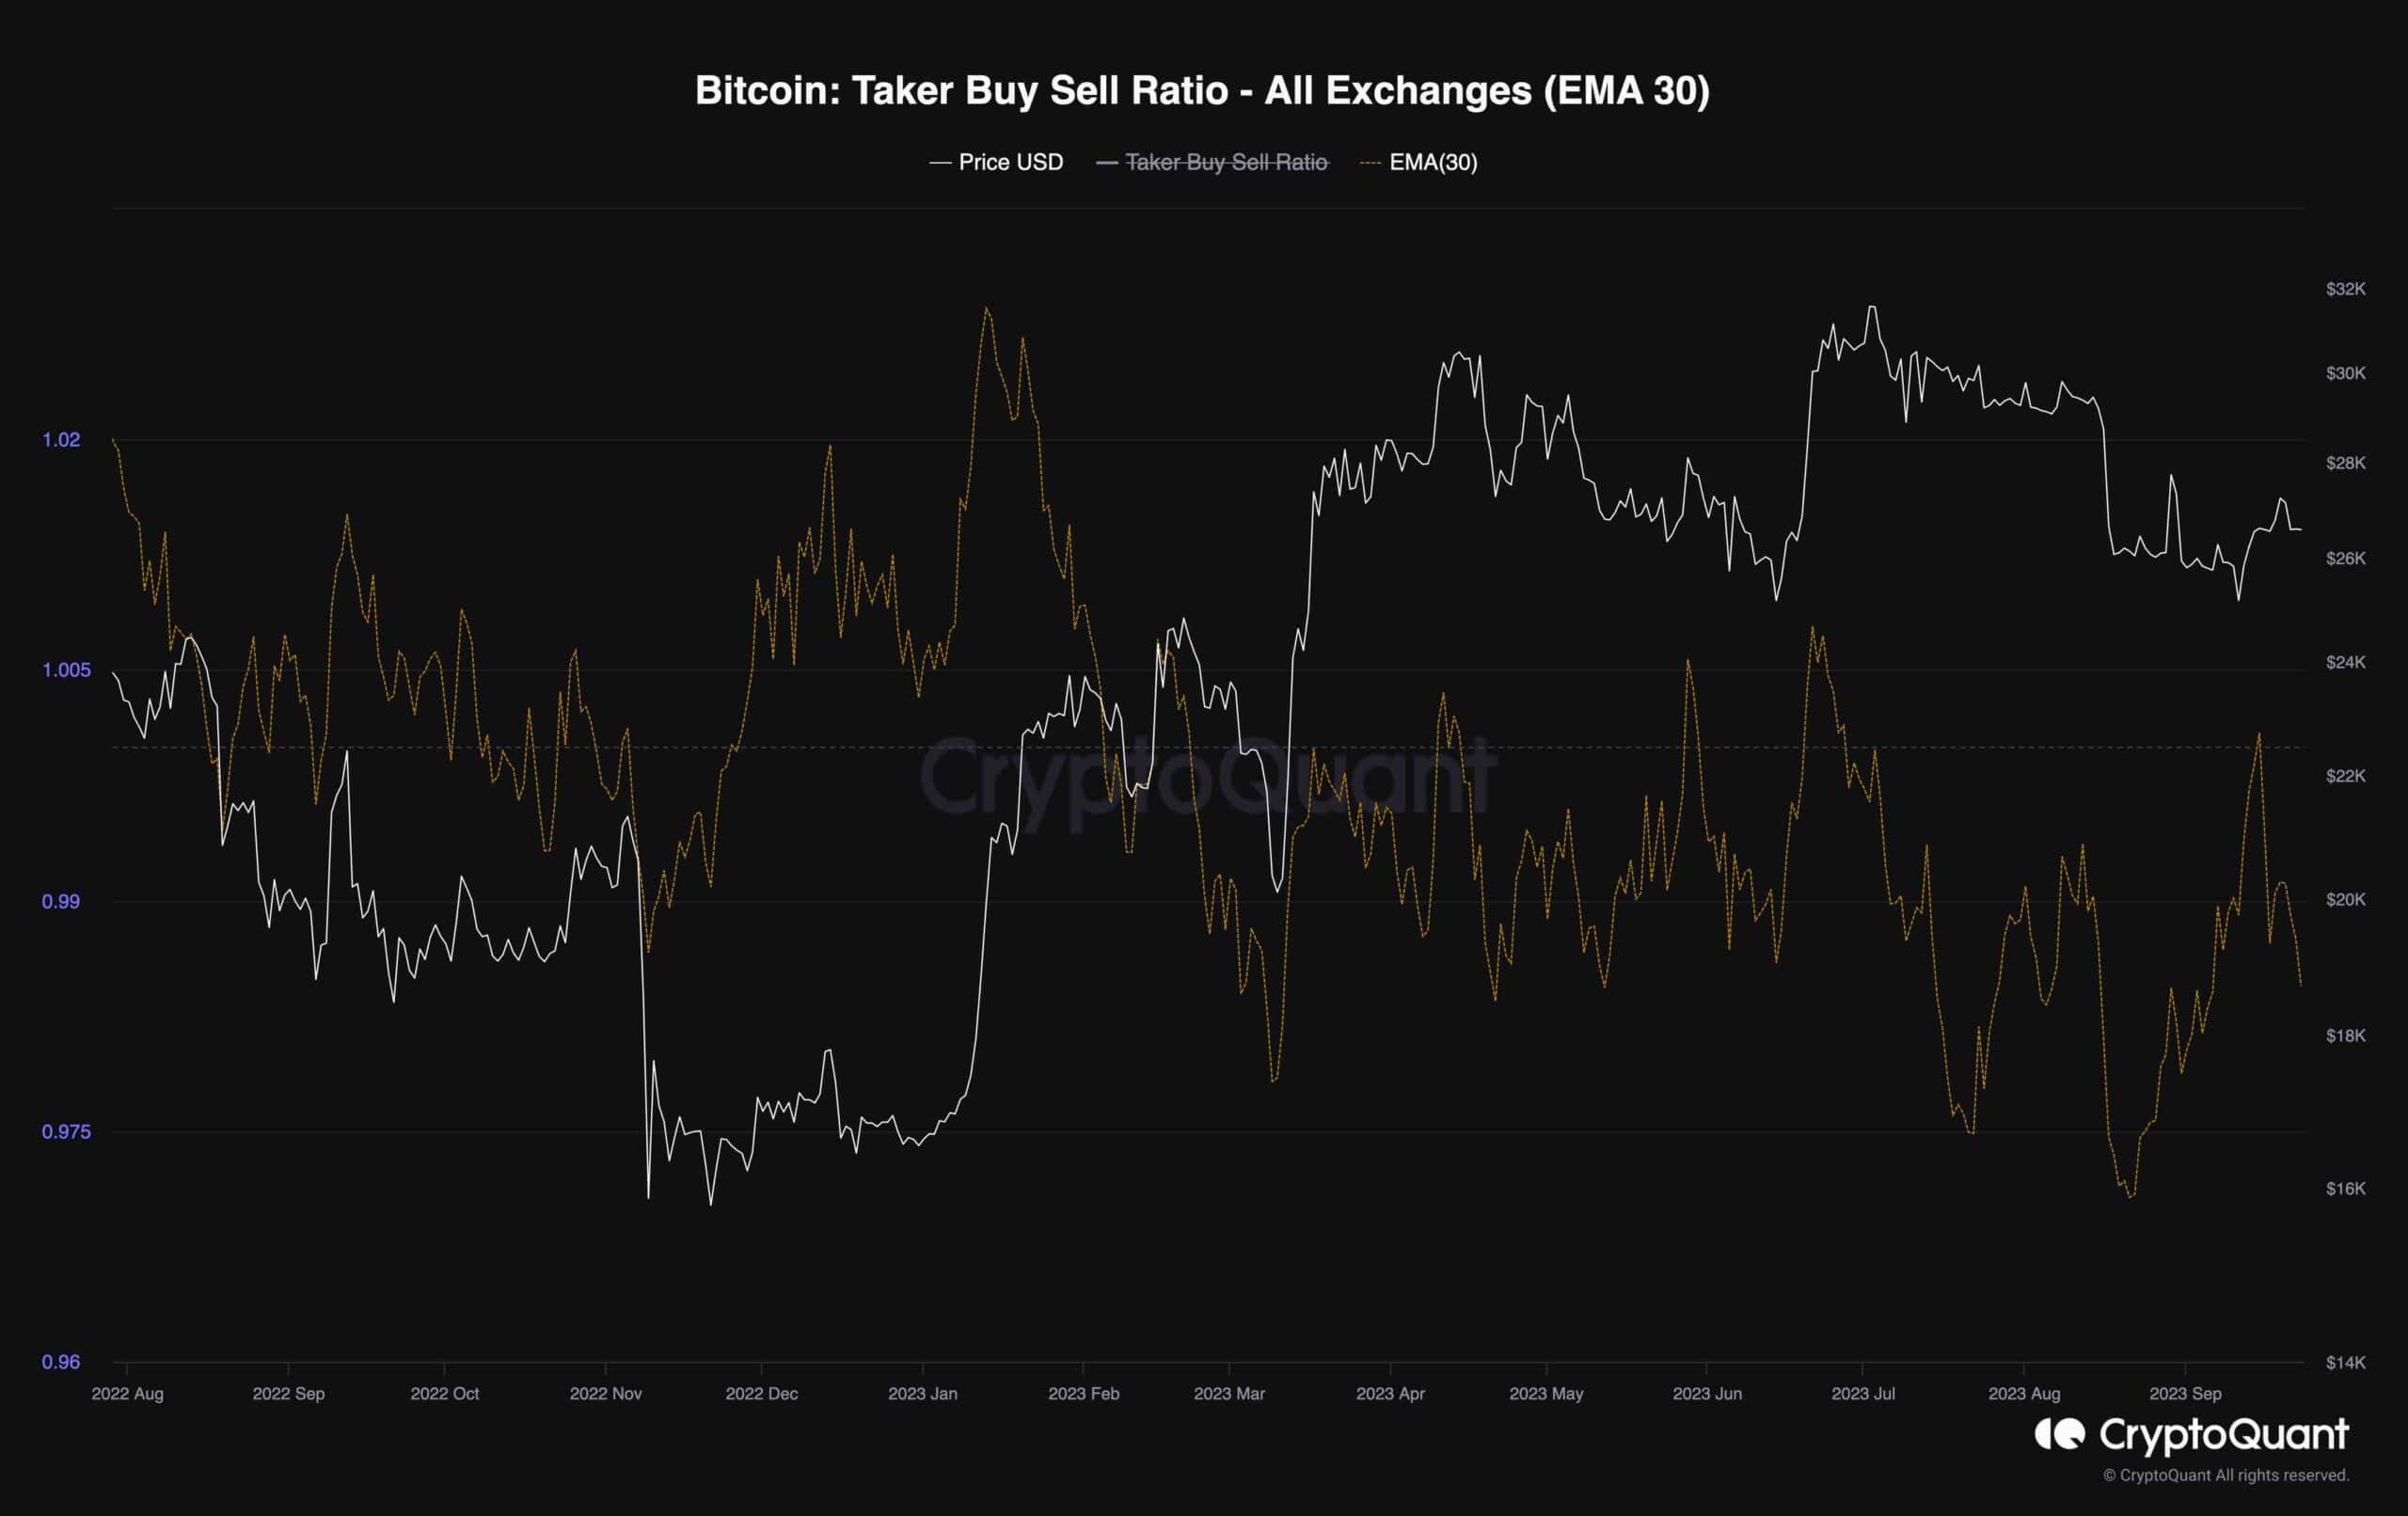
The chart shows the Bitcoin taker buy-sell ratio, an important indicator that reveals the intensity of long and short positions in the perpetual market. As the price movement is closely tied to market sentiment, data from the futures market, specifically the taker buy-sell ratio, provides valuable insights into the prevailing sentiment among traders.
In addition to the price pulling back towards the 200-day moving average, this metric has had a consistent downtrend, with readings consistently below 1. This trend indicates that futures traders predominantly hold a bearish view of Bitcoin. The prevalence of short positions among traders may put downward pressure on the price in the short term.
The post Bitcoin Dilemma: $25K or $30K Coming First? (BTC Price Analysis) appeared first on CryptoPotato.