Bitcoin Breaks $22.000 Just 5 Hours After Recording a New ATH
With just two weeks left before the end of 2020, Bitcoin seems to be giving hodlers a reward for the other terrible 350 days in which the world had to experience everything from fears of a new world war, massive fires in Australia, a global pandemic that caused markets to collapse, and the random appearance of some weird mysterious monoliths for no reason at all.
CryptoPotato recently reported that Bitcoin broke the $20,000 mark, raising the new ATH to over $21,000. “Bitcoin continues with its price discovery and it’s particularly interesting to see where it would head up next.” the article said. Well, it seems “next” means “up” —at least in the short term.
After breaking the $21,000, the Bitcoin bulls didn’t want to know about supports and pressed for new horizons. In just 5 hours, they managed to climb to $22,000, bringing the total marketcap of the world’s largest crypto from $360 Bn to about $409 Bn in one day.
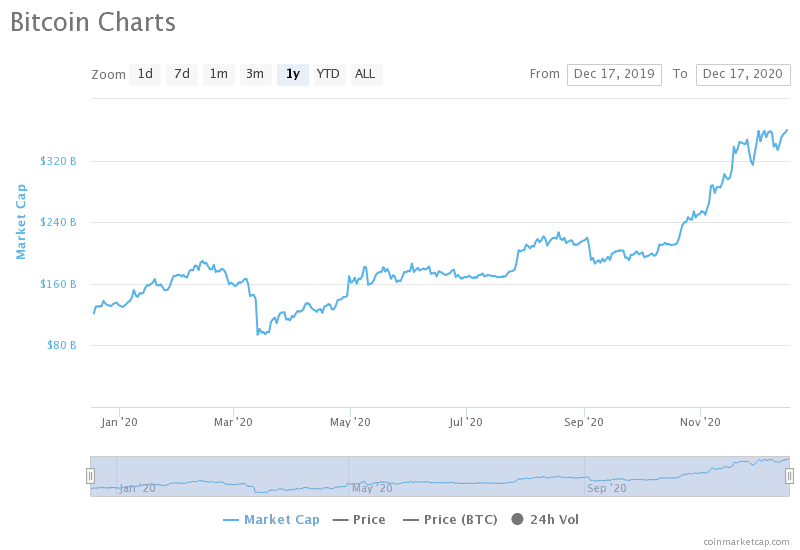
This would be the largest market cap in Bitcoin’s history, and it marked the moment when ALL the BTC hodlers in the world could say they had made a profit.
At the time of writing, the price of BTC is $22117 per token.
Bitcoin is Looking Good on the Charts, But Caution is Advised
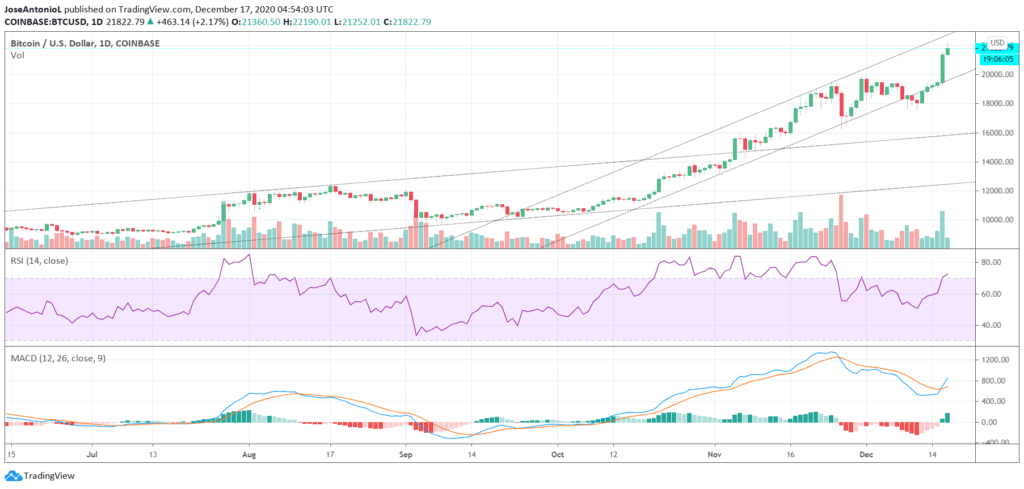
From a technical point of view, Bitcoin is in uncharted territory, but some indicators look optimistic. The MACD on 4 and 24 hour candles shows a cross that could indicate a change towards an upward trend in the coming days.
The RSI is high, so caution is advised; however, it is not yet at the extreme levels shown on previous occasions, so it could still give room for a price increase before the bulls want to take a break.
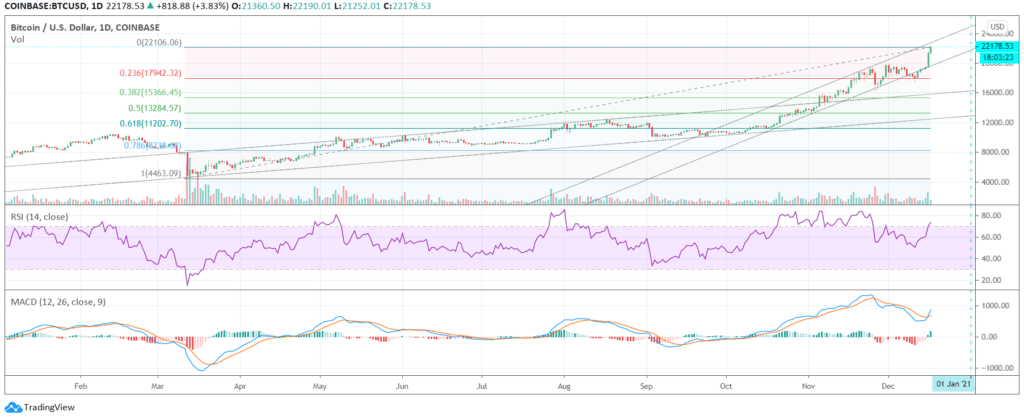
For long term hodlers, the first strong support in case of a possible correction is near $17950 according to the Fibonacci retracements and $19700 according to the bullish channel support line that has been respected since October. This same channel puts Bitcoin between $21,000 and $25,000 by the end of the year.
What’s Behind The Bullrun?
Many factors could explain the fundamentals behind this bullish run, with the Bitcoin halving as one of the most important to consider.
Besides the token shortage caused by institutions’ appetite, Bitcoin’s own algorithm lowered the supply by 50%, and the markets could be feeling the effects. The Stock-to-flow model looks pretty accurate in this regard, although its prediction of $30,000 by the end of the year might be a bit too optimistic.

Another major thing to notice is the recent wave of institutional investments and new products oriented to Bitcoin investments.
Square started the bull run when it announced a $50 million investment in Bitcoin and PayPal stepped on the gas when it announced support for buying and selling cryptocurrencies
But the “crypto god” has undoubtedly been Michael Saylor, CEO of MicroStrategy, who went from having just another successful company, to be the discussion topic on many debates in the crypto-verse after his massive investments in Bitcoin. He currently owns about half a billion dollars in Bitcoin, with intentions of doubling his BTC stash.