Bitcoin Battles for $40K but Was Local Bottom Confirmed? (BTC Price Analysis)
Bitcoin’s price is still consolidating at the $40K area, following a rejection from the 50-day and 100-day moving averages. These levels act as resistance after getting broken to the downside a few weeks ago.
Technical Analysis
Technical Analysis By Edris
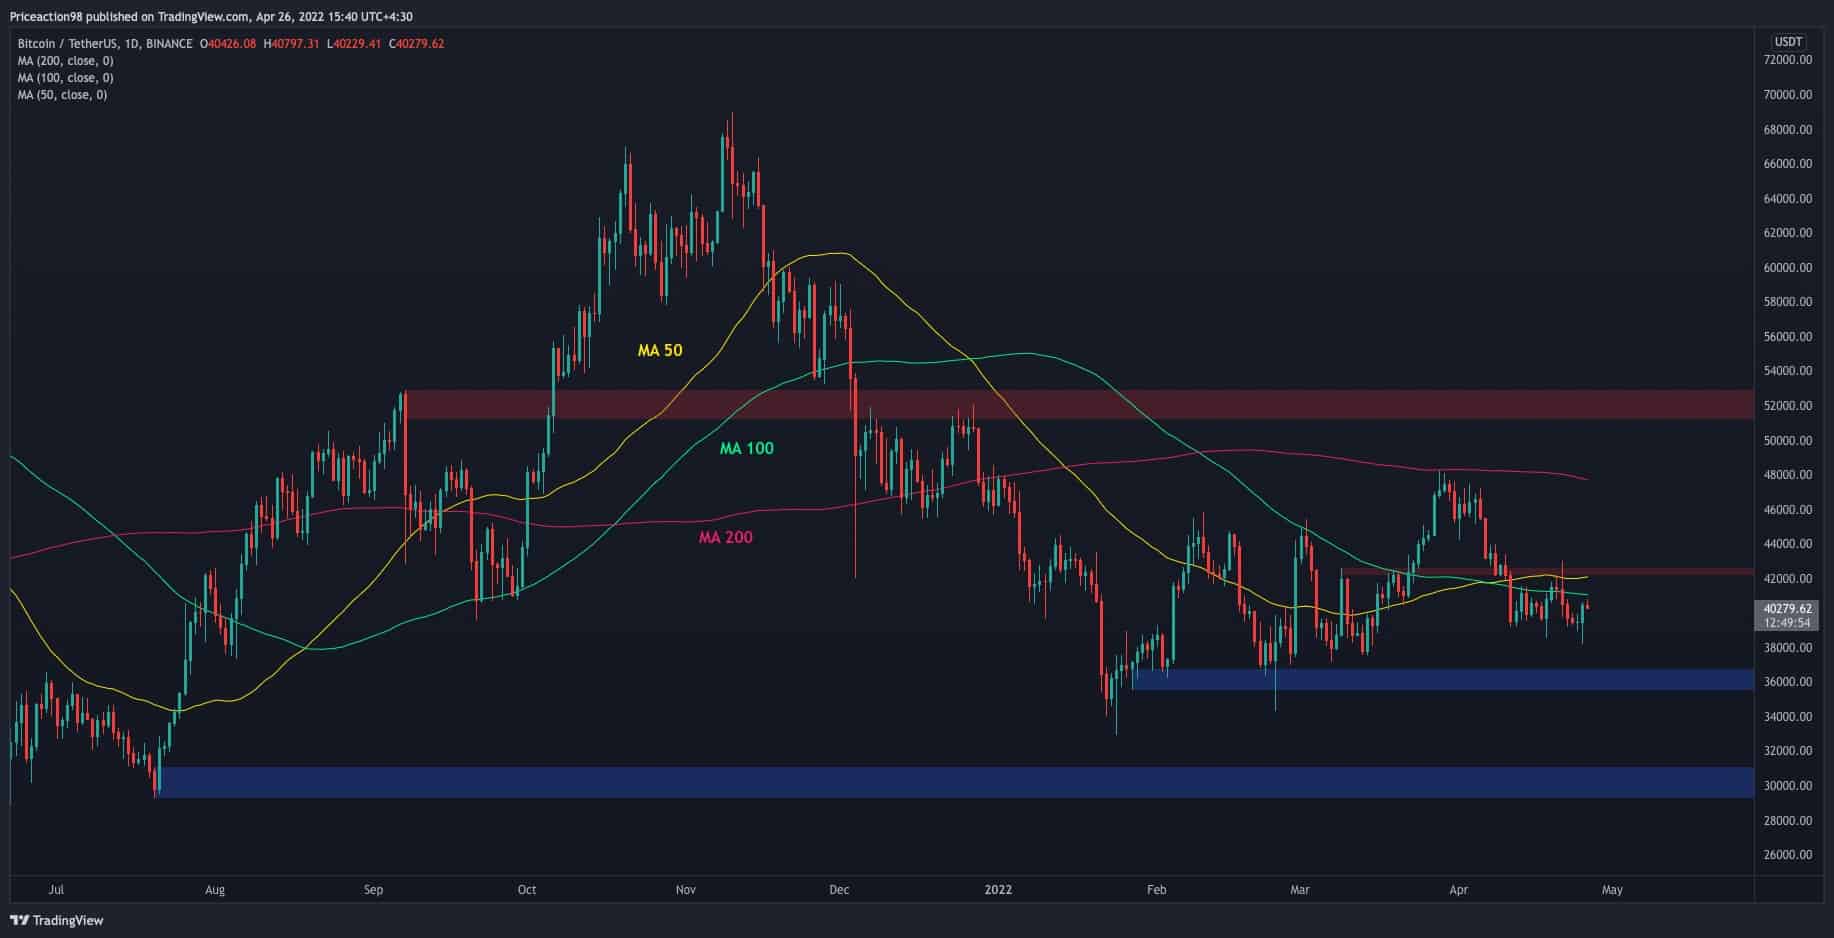
The Daily Chart
The price has rebounded from the $40K level again and is trying to get above the 100-day moving average. If a bullish breakout occurs, the 50-day moving average and the $42K zone would offer significant resistance, followed by the 200-day moving average.
On the other hand, if demand fails and the 100-day moving average rejects the price, the $36 area would be the first significant support. Bitcoin’s price has been unable to close below this level for the past couple of months, and it’s an important level for the bulls to defend.
The 4-Hour Chart
On the 4-hour timeframe, we can spot what seems to be a fake breakout below the $39K level. A bullish reversal could be anticipated, as the RSI indicator signaled that Bitcoin is oversold (below 30%) on this timeframe.
However, the price is struggling to break past the $40.5K supply zone, which could initiate a bearish continuation to the downside. In this case, the lower trendline of the vast bearish flag and the $36K level would be the following key levels to watch.
On the opposite side, if the price can get past the mentioned supply zone, the 42K zone would be a strong resistance which could be a turning point for the market. Overall, the trend leans bearish until a breakout above the $43K occurs. Higher prices could be expected, leading to a potential bearish flag failure.
Onchain Analysis
Onchain Analysis By Shayan
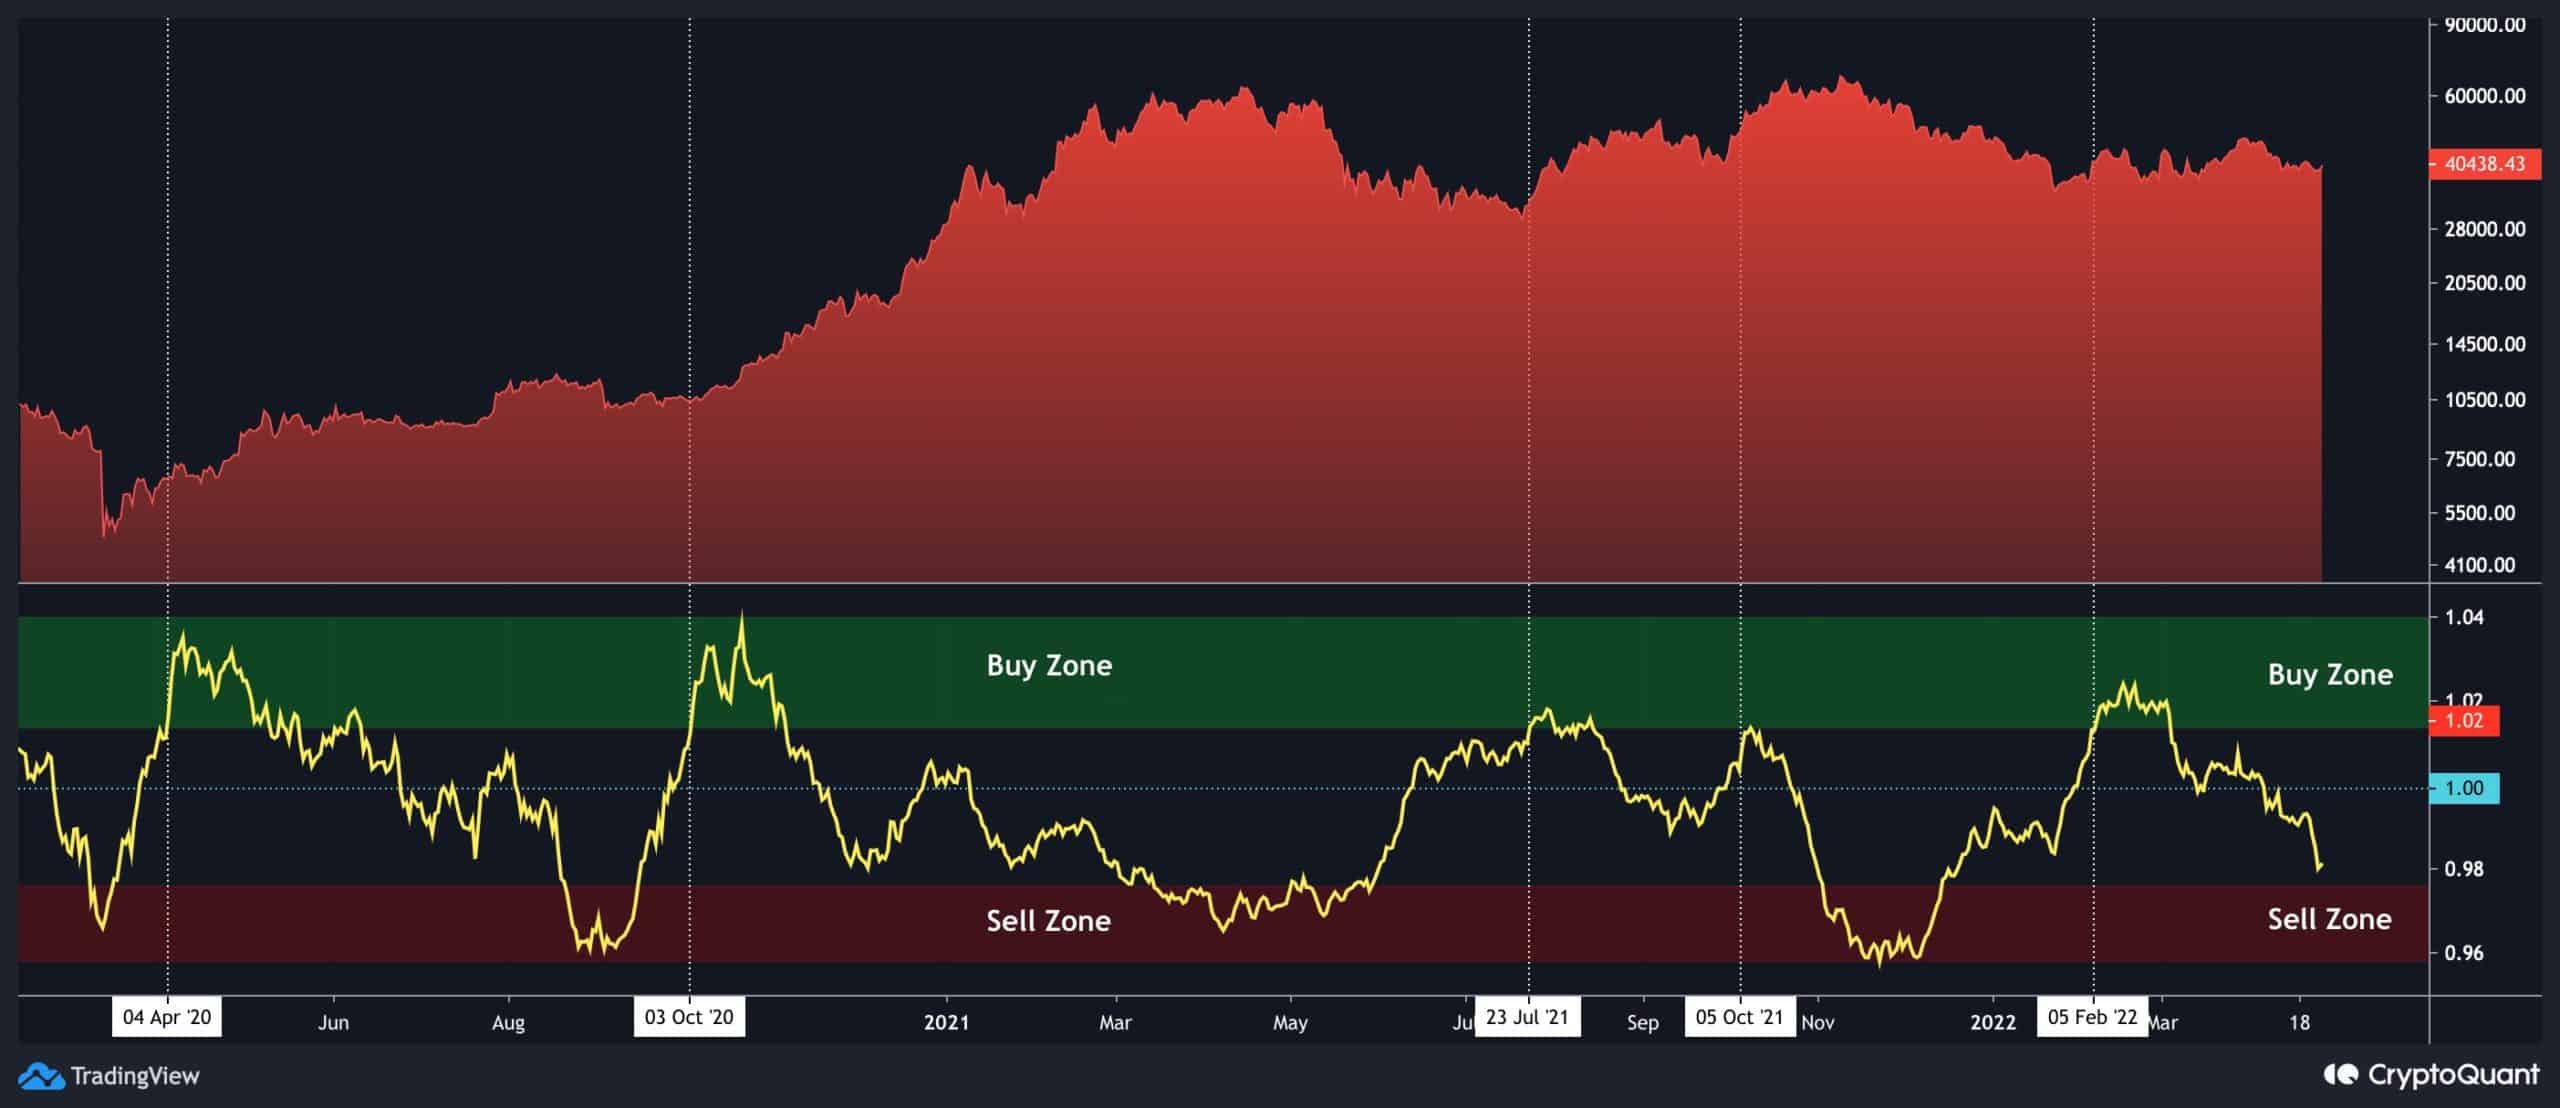
This chart consists of the 30-day moving average of the Taker Buy/Sell Ratio metric and Bitcoin’s price. Values above 1 indicate that more buyers are willing to obtain coins at a higher price, showing that buying pressure is more robust than selling. There is a strong possibility of a price rise, which shows the bullish sentiment. On the other hand – values below 1 indicate that more sellers are willing to dispose of coins at a lower price showing that sell pressure is stronger.
Historically, when the moving average hits the red zone, it indicates intense selling pressure and is a bearish signal. When it reaches the green area, it suggests high buying pressure and is a bullish sign. Currently, the MA is plummeting significantly and is getting to the red zone; hence, another short-term bearish leg is probable.