Binance Coin Price Analysis: Following The Hack, Will BNB Hold $20?
Binance Coin had dropped 4% over the past 24 hours of trading, bringing the current trading price down to around $20.63. This happens in response to the recent $40 million Binance hack.
However, the cryptocurrency is still on the green side enjoying a 90 day trading period whereas BNB price action has increased by a total of 191%.
Binance Coin is ranked on the 7th place amongst the top cryptocurrencies by market cap. The coin holds a $2.93 billion market cap value and trades at a price 18% lower than its ATH price.
Looking at the BNB/USD 1-Day Chart:
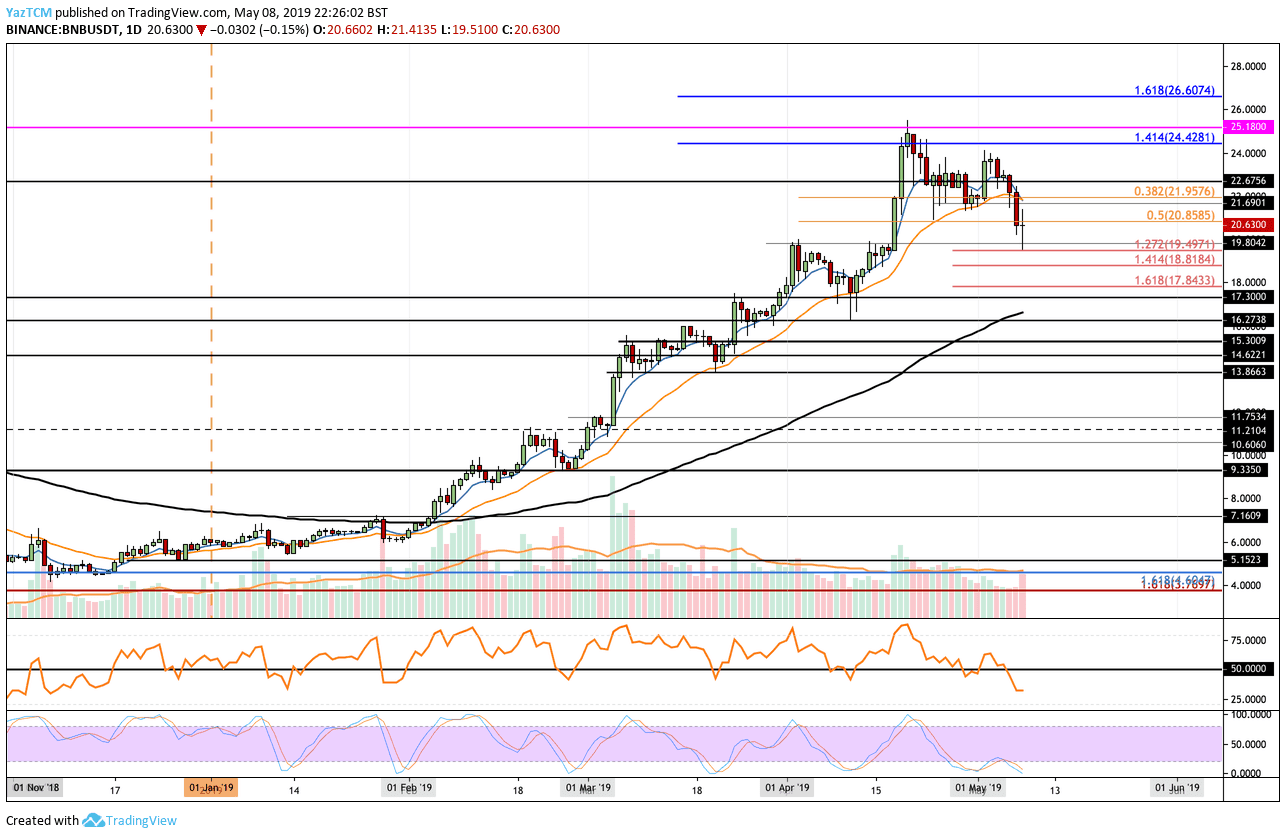
- Since our last BNB/USD price analysis, we can see that the market had failed to make a move surpass the $24 price level and continued to drip lower. The market has now fallen into support at the $20.85 level which contains a short term .5 Fibonacci Retracement level.
- From above: The nearest level of resistance now lies at $21.95 – $22.00. Further resistance then lies at $22.67, $24.42 and $25.18 which is the previous ATH for BNB/USD.
- From below: The nearest level of support now lies at $20. Further support is expected at $19.47, $18.81 and $17.84. These are the short term downside 1.272, 1.414 and 1.618 Fibonacci Extension levels .
- The RSI has recently slipped beneath the 50 level which indicates that the sellers have regained control of the market momentum. However, the Stochastic RSI is poised to place a crossover above signal which would result in some bullish pressure.
- The trading volume has shown some signs of increasing during the latest sell-off, which adds to the bearish momentum.
Looking at the BNB/BTC 1-Day Chart:
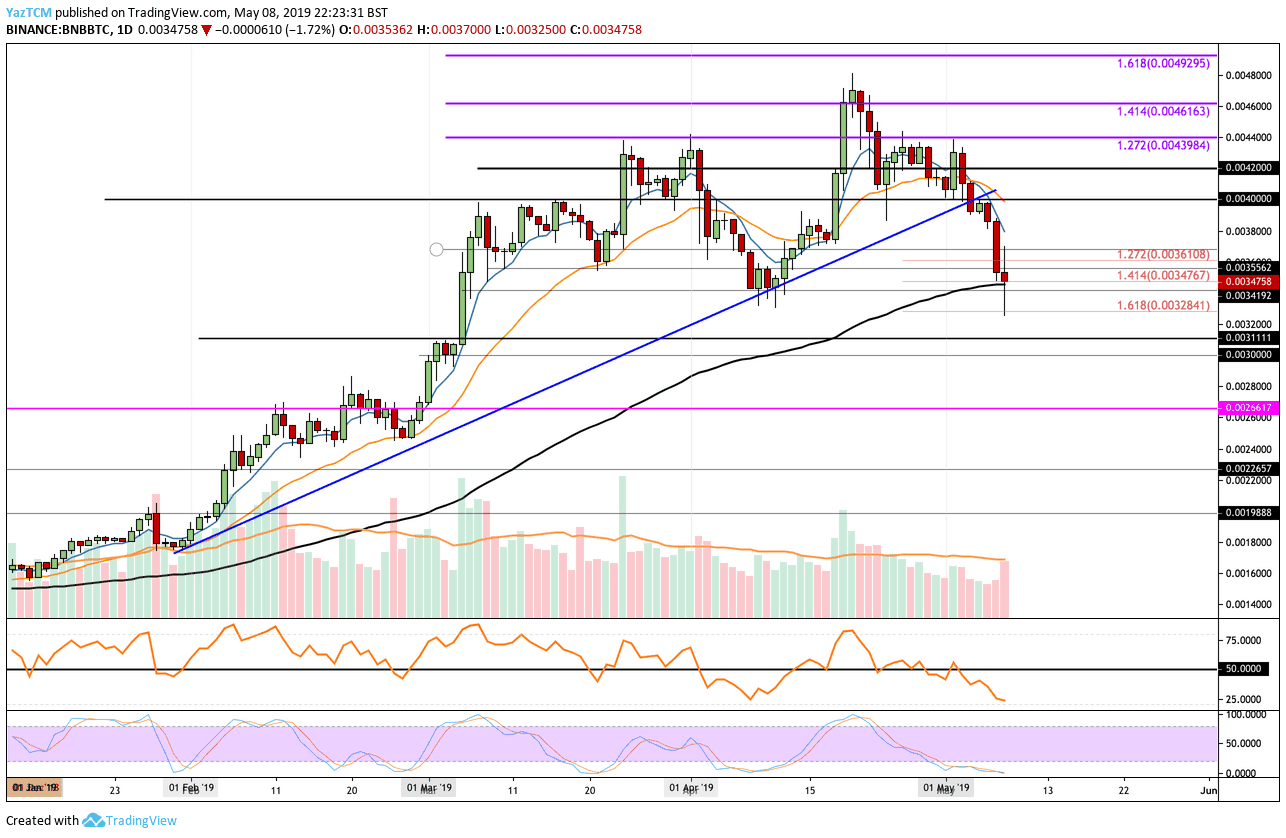
- Following our previous BNB/BTC analysis, we can see that the market dropped beneath the support at the long term ascending trend line we have been following. Following the breakdown, the coin continued further lower against Bitcoin into support around the 0.003476 BTC level. This level of support is bolstered by the 100 day moving average level and a short term downside 1.414 Fibonacci Extension level.
- From above: The nearest level of resistance now lies at 0.0036 BTC, 0.0038 BTC and 0.004 BTC. Above 0.004 BTC more resistance lies at 0.0042 BTC and 0.044 BTC.
- From below: If the sellers break beneath the 100 days moving average line, support lies at 0.003284 BTC. Further support beneath lies at 0.0032 BTC and 0.003111 BTC.
- The RSI indicates that the bears are in control of the market momentum, however, the Stochastic RSI is around the oversold area, which could lead to a correction.
The post Binance Coin Price Analysis: Following The Hack, Will BNB Hold $20? appeared first on CryptoPotato.