Binance Coin Price Analysis: Following IEO Ann, BNB Breaks Above $30 Again, Are The Bulls Back
Binance Coin saw a serious increase of around 16% over the past 2 days, bringing its price to where it currently stands at $31.20. The cryptocurrency is up 54% over the past 3 months.
The latest surge follows the announcement of the newest IEO to be held on Binance Launchpad, which has substantially different participation requirements. Moreover, BNB seems unfazed by the recent news that a serious amount of KYC photos have been supposedly leaked off its system.
BNB remains the sixth-largest cryptocurrency with a market cap of $4.77 billion.
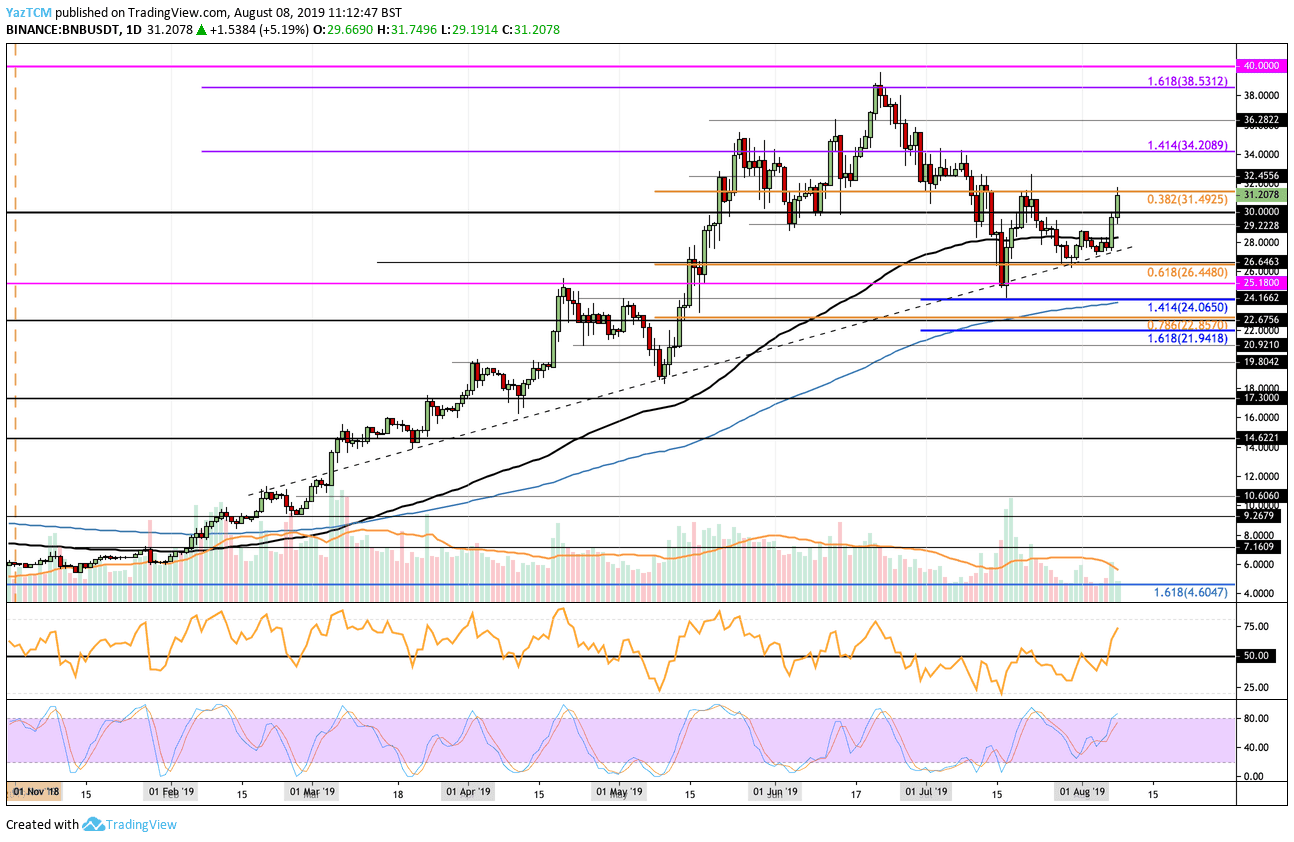
Looking at the BNB/USD 1-Day Chart:
- Since our previous BNB analysis, BNB had continued to hold the support at the rising trend line which allowed the rebound to happen. BNB/USD powered through the 100 days EMA to break above $30 and reach the resistance at $31.50.
- From above: If the bulls can push the price above $31.50, we can expect immediate resistance to be located at $32.45 and $32.40. After that, the next levels of resistance lie at $35, $36.28, and $38.53. If the bulls clear this level the coin will be free to make an attempt at its ATH and reach $40.
- From below: The nearest level of support is now located at $30. Beneath this, further support lies at $29.22, $28 (100 days EMA), and the rising trend line. If the sellers push below the trend line, support can be found at $26.48, $25.18, and $24.
- The trading volume has started to show signs of increase as it reaches the average level.
- The RSI has recently stormed above the 50 level which shows that the bulls are now in complete control of the market momentum.
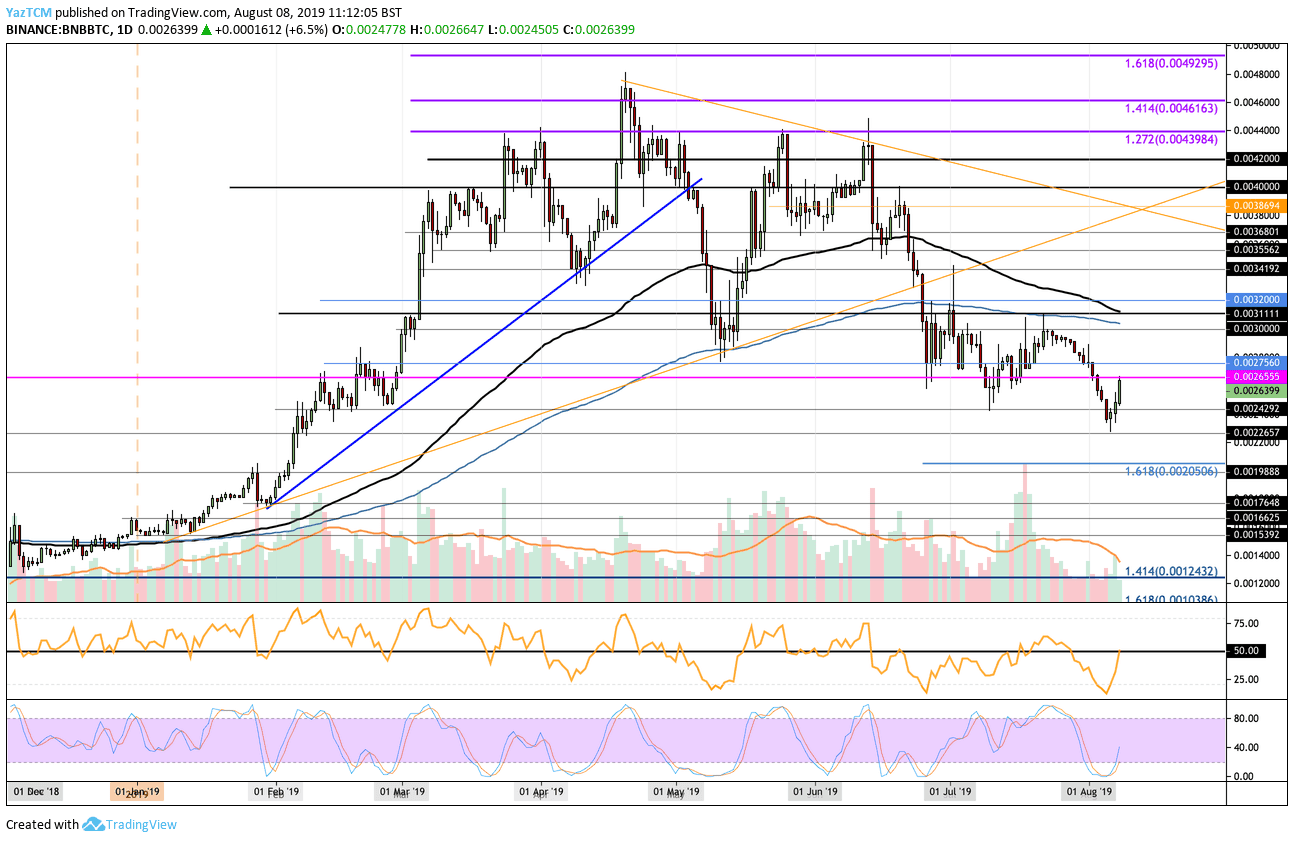
Looking at the BNB/BTC 1-Day Chart:
- Against Bitcoin, the support at 0.002265 BTC held very well, allowing BNB to go higher. We can see that the coin has now reached the resistance at the 0.002655 BTC level.
- From above: If the bulls continue above 0.002655 BTC, we can expect higher resistance to be located at 0.002765 BTC, 0.0029 BTC, and 0.0030 BTC (100 days EMA). Above 0.003 BTC, the next levels of resistance lie at 0.0031111 BTC (200 days EMA) and 0.0032 BTC.
- From below: The nearest levels of support lie at 0.0026 BTC, 0.002492 BTC, and 0.002265 BTC. Beneath this, further support is expected at 0.0022 BTC, 0.00205 BTC, and 0.001988 BTC.
- The trading volume has also shown signs of increase here.
- The RSI has risen toward the 50 level but has still yet to break above. This indicates that neither the bulls nor the bears are in possession of the market momentum. If we would like to see BNBBTC rise higher, we will need to see the RSI break above 50.
The post Binance Coin Price Analysis: Following IEO Ann, BNB Breaks Above $30 Again, Are The Bulls Back appeared first on CryptoPotato.