Binance Coin Price Analysis: Bnb Tumbles Below $30 And At 5-Month Low Against BTC
The price of Binance Coin tumbled over the past 24 hours, decreasing by more than 7.4%. This brought it to its current levels below $30 as it trades at around $29.58 at the time of this writing. The recent price fall coincides with the sharp decline in Bitcoin.
Despite the recent pullback, Binance Coin is still up by a total of 63% over the past 3 months. BNB remains the 7th largest cryptocurrency with a market cap of $2.4 billion.
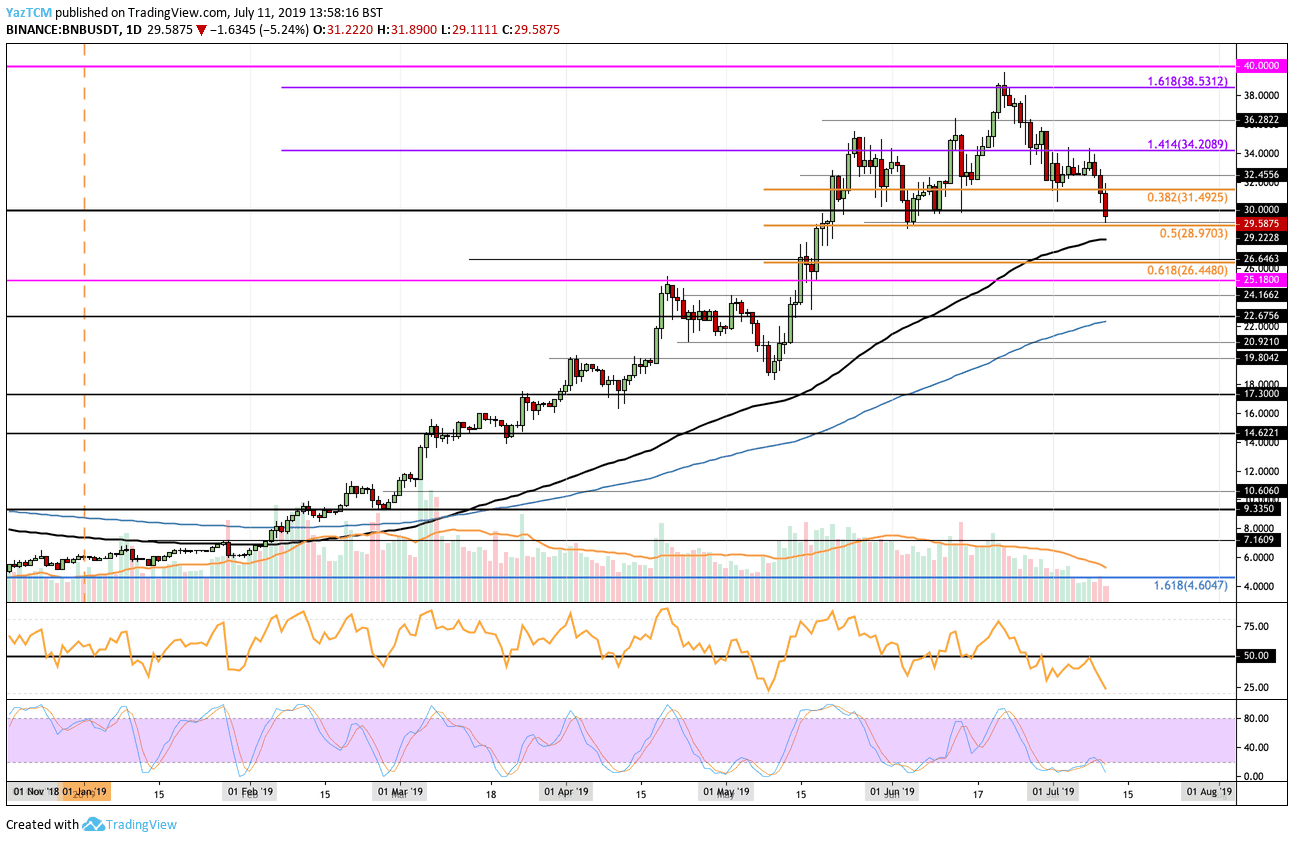
Looking at the BNB/USD 1-Day Chart:
- Since our previous BNB analysis, BNB struggled to break above the $34.20 resistance level and eventually rolled over at this level. The market then went on to drop which led to BNB falling below $30 and reaching the current support at the $28.90 level provided by a short term .5 Fibonacci Retracement.
- From above: The nearest level of resistance lies at $30. If the bulls climb back above $30, higher resistance lies at $31.50, $32.50, and $34. If the buyers can continue to break above the $34.20 mark, the next levels of resistance above lie at $35, $36, and $38.53.
- From below: The nearest level of support lies at $28.90. Beneath this, further support lies at $28 (which is strengthened by the 100 days EMA) and $26.44 (provided by the short term .618 Fib Retracement). If the sellers continue below $26.44, the next level of strong support lies at $25.18.
- The trading volume has been steadily declining this month and is far below the yearly average.
- The RSI has recently slipped from an attempt to break above the 50 level which shows that the bears are in complete control over the market momentum. From this assessment, we can assume that BNB will continue to drop further lower.
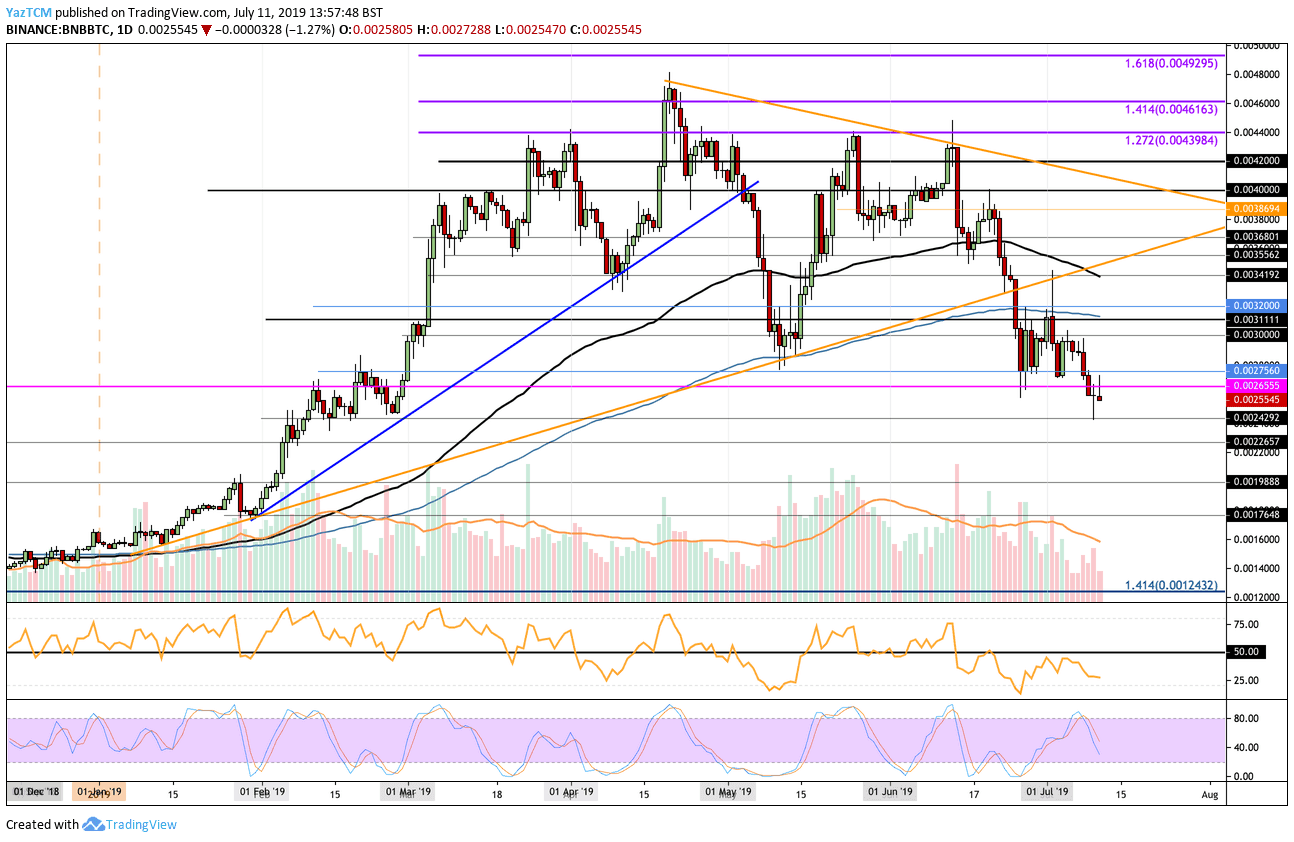
Looking at the BNB/BTC 1-Day Chart:
- BNB has also been suffering against Bitcoin. The recent drop beneath the 0.002655 BTC level has caused BNB/BTC to drop to fresh 5-month price lows. We can see that the market had found support at 0.002429 BTC yesterday but BNB still looks like it will head lower.
- From above: If the bulls can bring the price above 0.002655 BTC, higher resistance lies at 0.002756 BTC, 0.0029 BTC, and 0.003 BTC. If the bulls can continue above 0.003 BTC, further resistance lies at 0.003111 BTC (contains the 200 days EMA) and 0.0032 BTC.
- From below: The nearest level of support toward the downside lies at 0.002429 BTC. Beneath this, further support lies at 0.0024 BTC, 0.002265 BTC, 0.0022 BTC, and 0.0020 BTC.
- The trading volume has also been diminishing within this market.
- The RSI has also recently turned away from the 50 level which shows the sellers remain in control of this falling market.
The post Binance Coin Price Analysis: Bnb Tumbles Below $30 And At 5-Month Low Against BTC appeared first on CryptoPotato.