Binance Coin Price Analysis: BNB Bulls Attempt To Step In, Is $30 In Sight?
Binance Coin has seen a small price increase of 2% over the past 24 hours, and it’s currently trading at around $28.07. This slight uptick comes after Binance Launchpad completed its 7th IEO – WINk, which gave its investors a maximum ROI of around 800%
Binance Coin remains the sixth-largest cryptocurrency with a market cap of $4.36 billion. The cryptocurrency has seen a month of decline as it lost around 16% over the past 30 days. However, it seems that the bulls could be ready to turn things around and push higher.
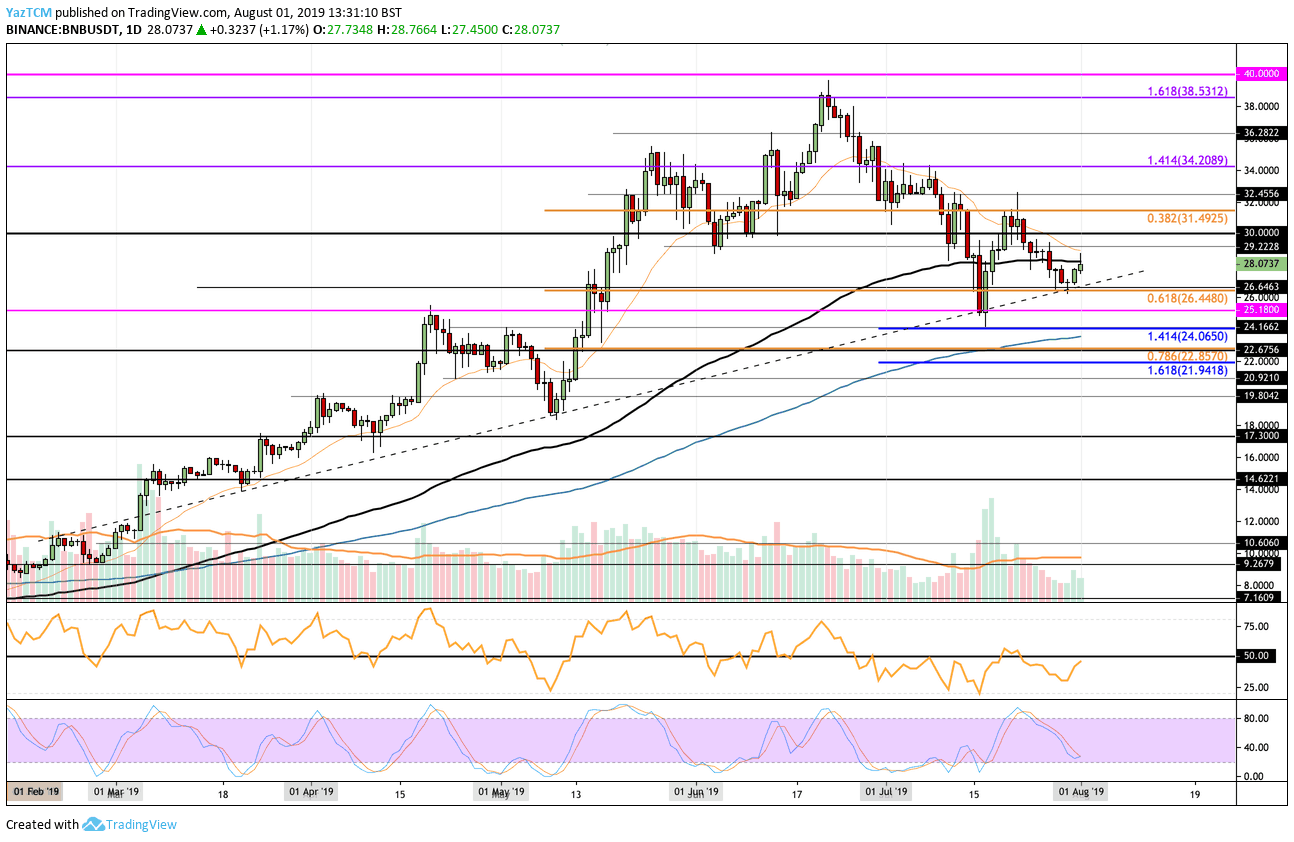
Looking at the BNB/USD 1-Day Chart:
- Since our previous BNB analysis, the market went on to reverse at our expected level of resistance at $31.49. After rolling over at this resistance, BNB pulled back to find support at the $26.44 level, provided by a short term .618 Fib Retracement. Furthermore, this area of support is also bolstered by a long term rising trend line.
- From above: BNB has to contest very strong resistance at $28 which is provided by the 100 days EMA. The market will require significant strength to break above it. If the bulls continue to go beyond $30, higher resistance is then found at $31.49, $32.45, $34, $35, and $36.28.
- From below: The nearest level of support lies at $26.44, which is bolstered by the rising support trend line. Beneath this, further support lies at $25.18, $24.06, and $22.85.
- The trading volume has started to pick up over the past couple of days.
- The RSI has reapproached the 50 level as the bulls attempt to gain control of the market momentum. Furthermore, the Stochastic RSI has produced a bullish crossover signal which helps the bullish case.
Looking at the BNB/BTC 1-Day Chart:
- Against Bitcoin, BNB was unable to overcome the resistance at 0.003 BTC. It had spiked slightly higher into 0.003111 BTC but had met resistance at the 200 day EMA which caused the market to fall. BNB has recently found support at 0.002750 BTC.
- From above: The nearest levels of resistance lie at 0.003 BTC and 0.003111 BTC. If the bulls can break above here, higher resistance lies at 0.0032 BTC (further bolstered by the 100 days EMA). Beyond 0.0032 BTC, we can expect more resistance at 0.003219 BTC, 0.00355 BTC, and 0.003680 BTC.
- From below: The nearest level of support lies at 0.002750 BTC. Beneath this, lower support is located at 0.002655 BTC, 0.002482 BTC, 0.002265 BTC, and 0.0022 BTC.
- The trading volume has tailed out toward the end of July but looks like it may start to increase once again.
- The RSI is making its way toward the 50 level which shows that the selling pressure is diminishing. However, the RSI needs to break above 50 for the bulls to take control of the momentum.
The post Binance Coin Price Analysis: BNB Bulls Attempt To Step In, Is $30 In Sight? appeared first on CryptoPotato.