Binance Coin Price Analysis: BNB Breaks Above $30, Are Bulls Back in Town?
Binance Coin has marked an increase of 26% over the past 3 days, bringing its price back up above $30 to $30.50. The cryptocurrency had been suffering after dropping by 17% over the past 30 days; however, the bounce at the $25.18 support level allowed BNB to get back on the bullish track.
BNB has become the sixth largest cryptocurrency by market value with a market cap of $4.72 billion.
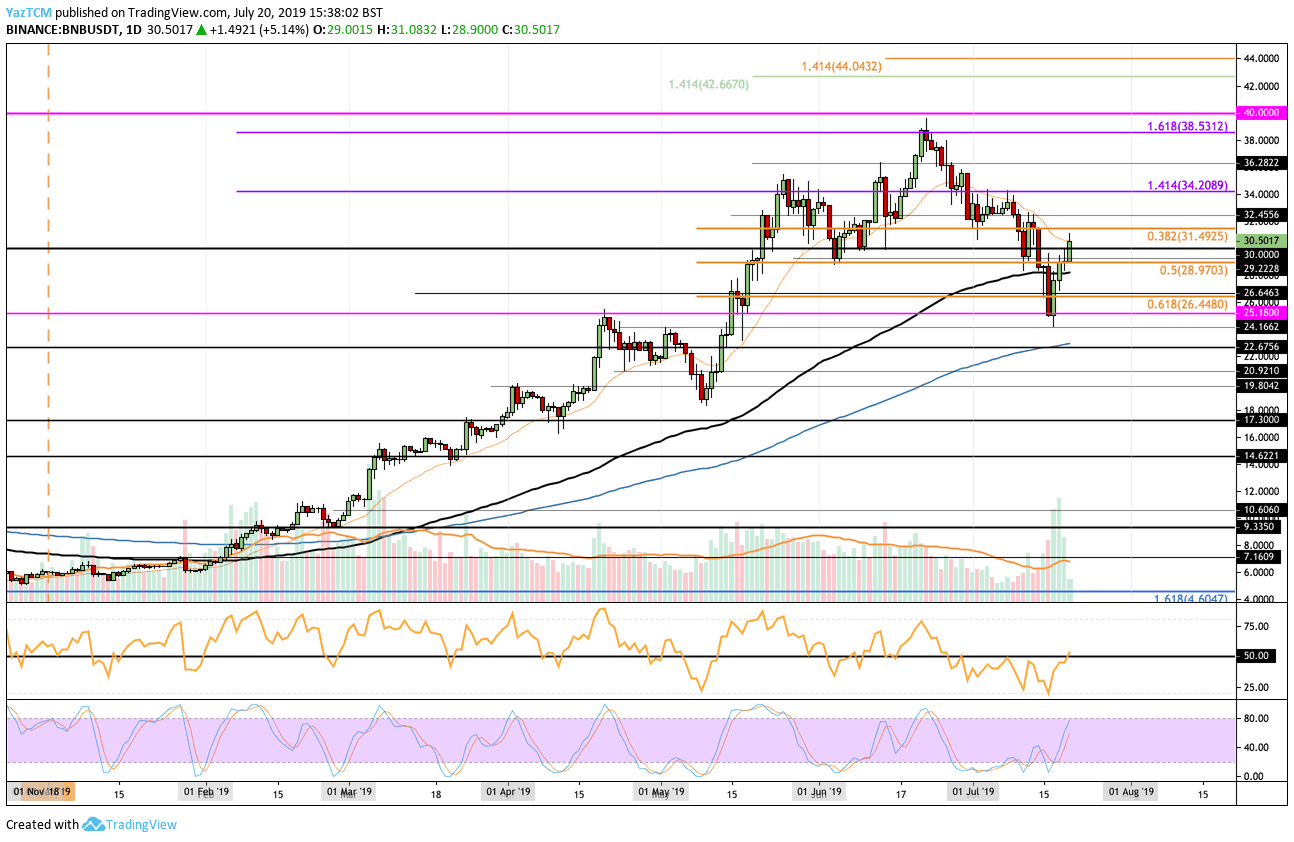
Looking at the BNB/USD 1-day chart:
- After our previous BNB analysis, BNB dropped beneath the support at the $28.90 level to find lower support at $25.18. We expected that level to contain strong support because it had provided strong resistance for the market during April and May 2019. The recent bounce also allowed BNB to break above the 100-day EMA.
- From above: The nearest levels of resistance lie at $31.49 and $32.45. Above this, higher resistance is located at $34, $35, $36.28, and $38.55. If the bulls can push the price above $38.55, the next level of resistance is found at $40, which would be a fresh ATH.
- From below: The nearest levels of support lie at $30 and $28.30 (contains the 100-day EMA). Beneath this, further support lies at $28.89, $26.44, and $25.18.
- The trading volume has seen a large surge in the past few days.
- The RSI has battled its way from oversold conditions as it now attempts to break back above 50 to signal that the bulls are in control.
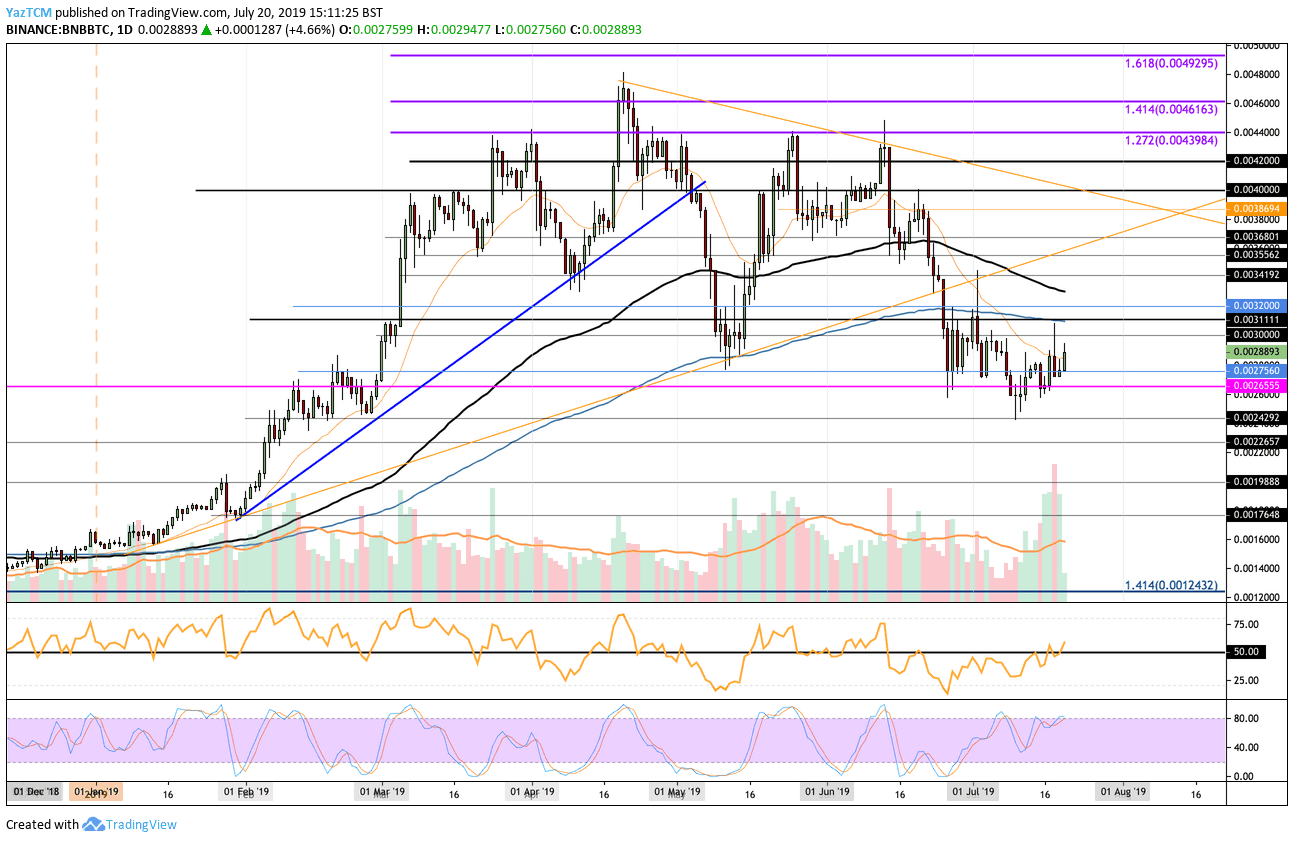
Looking at the BNB/BTC 1-day chart:
- Trading against Bitcoin, BNB recently stabilized somewhat around the 0.0026 BTC level. BNB has slowly grinded higher to 0.00288 BTC.
- From above: The nearest level of resistance lies at 0.003 BTC. Above this, higher resistance lies at 0.003111 BTC, which is reinforced by the 200-day EMA. If the bulls break above the 200-day EMA, the next levels of resistance lie at 0.0032 BTC, 0.0033 BTC, and 0.003419 BTC.
- From below: The nearest level of support lies at 0.002756 BTC. Beneath this, further support is located at 0.002655 BTC and 0.0026 BTC. If the sellers drive the BNB/BTC market beneath 0.0025 BTC, the next levels of support are found at 0.002493 BTC, 0.0023 BTC, and 0.002265 BTC.
- The trading volume has also seen a surge, creating fresh highs in the daily trading volume this year.
- This market’s RSI has also approached 50 as the bulls attempt to regain control of the market.
The post Binance Coin Price Analysis: BNB Breaks Above $30, Are Bulls Back in Town? appeared first on CryptoPotato.