Binance Coin Price Analysis: BNB Breaks Above $18, Are We Headed To $20?
Binance Coin saw a slight increase of around 1.58% over the past 24 hours and it currently trades at $18.17. The cryptocurrency has surged significantly by 16% this past week after managing to break above a long term descending wedge against BTC. This latest price hike has rendered the market bullish as it makes its way back toward $20.
Binance Coin is the eighth-largest cryptocurrency with a market cap of $2.83 billion.
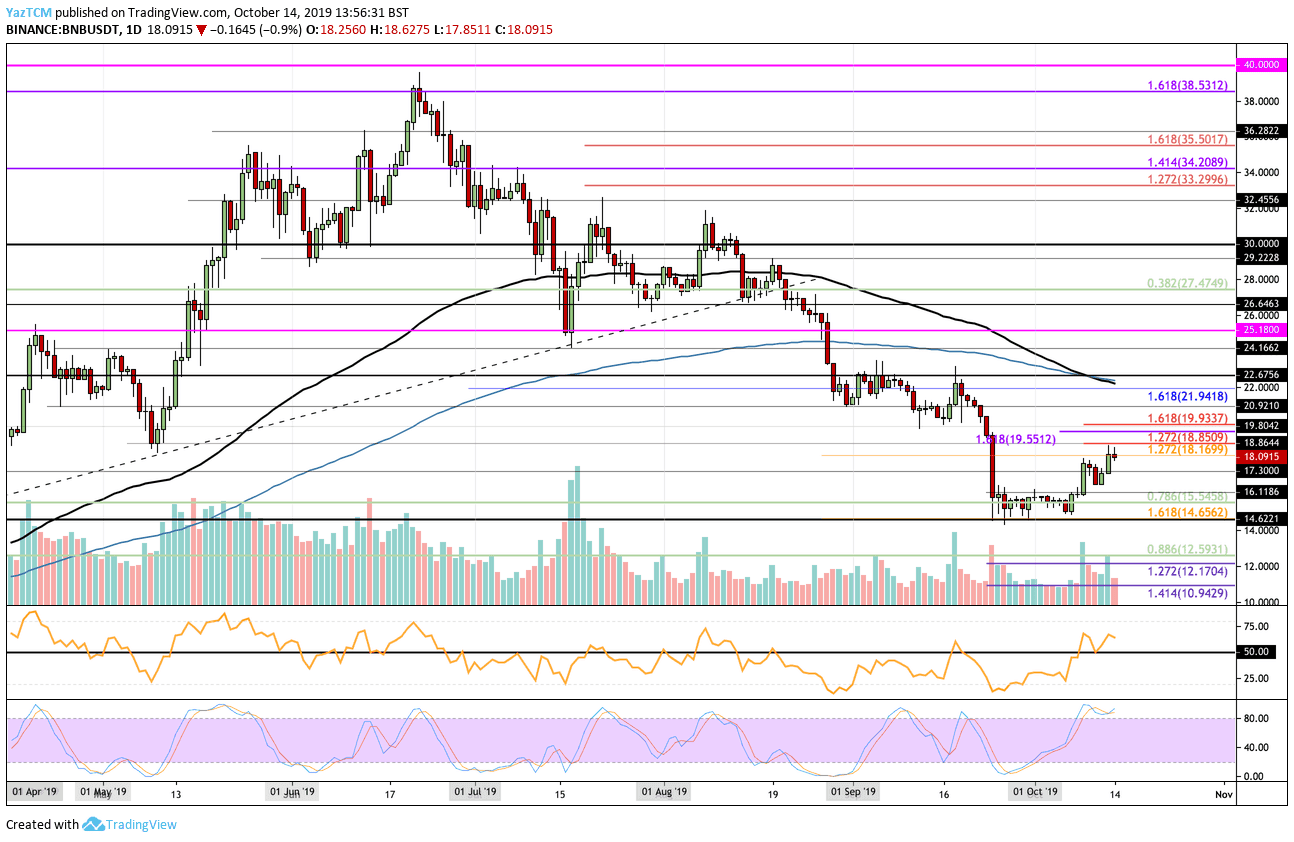
Looking at the BNB/USD 1-Day Chart:
- Since our previous BNB analysis, the cryptocurrency continued to increase from the support found at $16.80, reaching the resistance at $18.16. It even spiked to $18.85 where the short term 1.272 Fib Extension was and failed to break above it.
- From above: If the surge past $18.16 the nearest level of resistance lies at $18.85. Above this, resistance lies at $19, $19.55, and $19.93 (Short term 1.618 Fib Extension). If the bulls can break $20, higher resistance is expected at $20.92 and $22 (bolstered by 100-days and 200-days EMA’s).
- From below: The nearest level of support lies at $18. Beneath this, support lies at $17.30, $16.11, $15.54, and $14.65.
- The trading volume remains at an average level.
- The RSI has recently broken above the 50 level and has managed to remain above which is a strong sign for the bulls as they continue to control the market momentum.
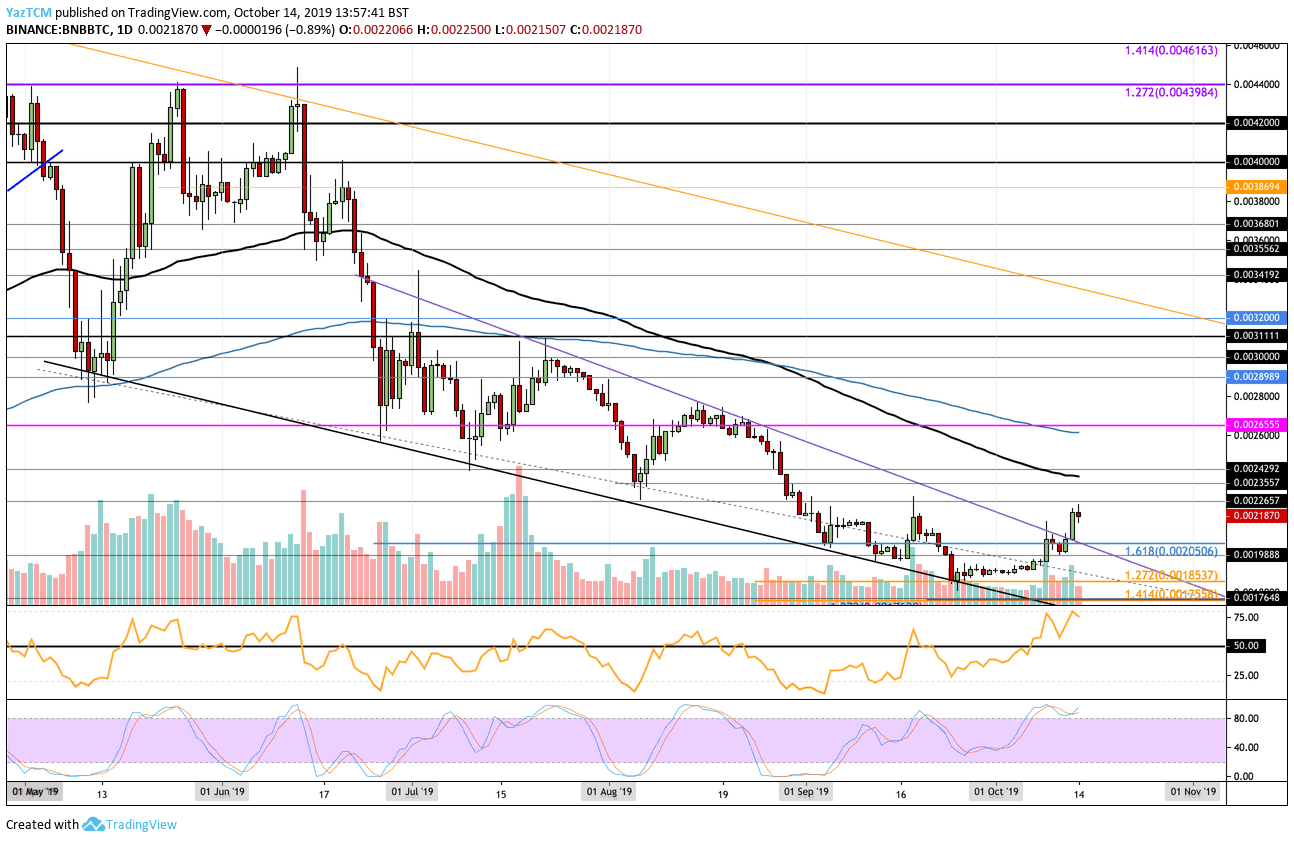
Looking at the BNB/BTC 1-Day Chart:
- Against Bitcoin, BNB managed to smash above the resistance 0.002 BTC, provided by the upper boundary of a descending wedge formation. BNB continued to climb further higher until meeting resistance at 0.022 BTC.
- From above: The nearest levels of resistance lie at 0.002 BTC and 0.002265 BTC. Above this, higher resistance is expected at 0.002360 BTC (100-days EMA) and 0.0025 BTC. Significant resistance above lies at 0.0026 BTC which is strengthened by the 200-days EMA.
- From below: The nearest level of support lies at 0.002 BTC. Beneath this, support lies at 0.001988 BTC, 0.0019 BTC, and 0.001853 BTC.
- The trading volume has seen a small increase during October.
- The RSI is well above the 50 level which shows that the bulls are in strong control over the market momentum. However, the Stochastic RSI is shaping up for a bearish crossover signal which tells us we must remain cautious and expect a small pullback.
The post Binance Coin Price Analysis: BNB Breaks Above $18, Are We Headed To $20? appeared first on CryptoPotato.