Binance Coin Enjoys Bitcoin’s Rally To Record a New ATH: BNB Price Analysis May 27
Binance Coin has continued to surge further over the past 7 trading days as the price increased by a total of 19.63%, bringing it to around $34.10.
Binance Coin had previously managed to increase even higher to create a fresh all-time high value of $35.48, making it the only coin in the top 50 projects to break its previous ATH prices.
Binance Coin remains ranked in 7th place amongst the top cryptocurrencies by market cap value as it currently holds a $4.83 billion valuation.
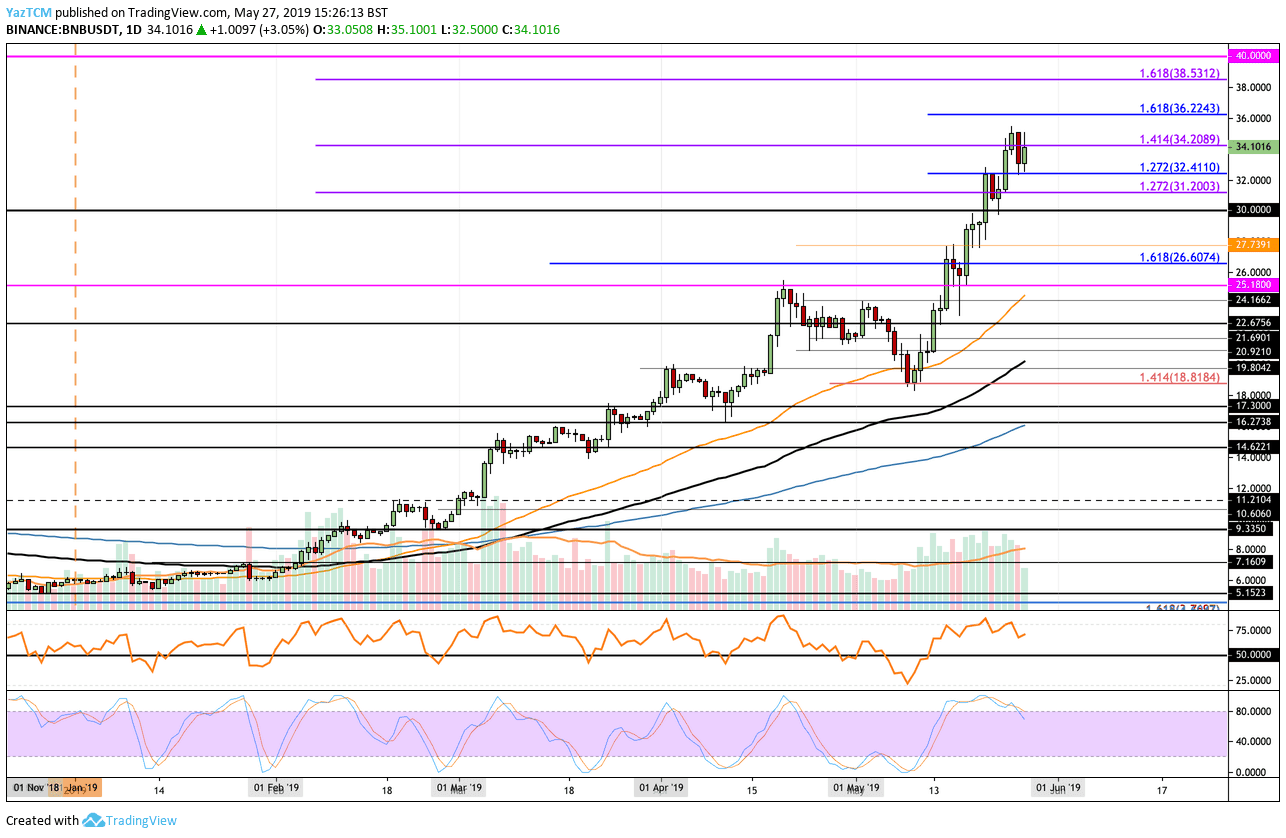
Looking at the BNB/USD 1-Day Chart:
- Against the USD, we can see that BNB has continued to climb higher above the resistance at $30 to reach the ATH at around $35.48. BNB/USD has fallen slightly and is currently trading at support at $32.41.
- From above: The nearest level of resistance now lies at $34.20. Above this, further resistance lies at $35 and then at $36.22 (provided by a short term 1.618 Fibonacci Extension level, marked in blue). Beyond $36.22, resistance is located at $38 and then $38.53 (provided by a long term 1.618 Fibonacci Extension level). Above $38.53, the next level of resistance lies at $40.
- From below: the nearest level of support now lies at $32.41 and $31.20. Beneath this, strong support is expected at $30. If the selling continues beneath $30, further support lies at $27.73, $26.60 and $25.18.
- The trading volume has remained consistently high during May 2019.
- The Stochastic RSI has recently produced a bearish crossunder signal in oversold territory which warns traders to be wary of a potential upcoming retracement.
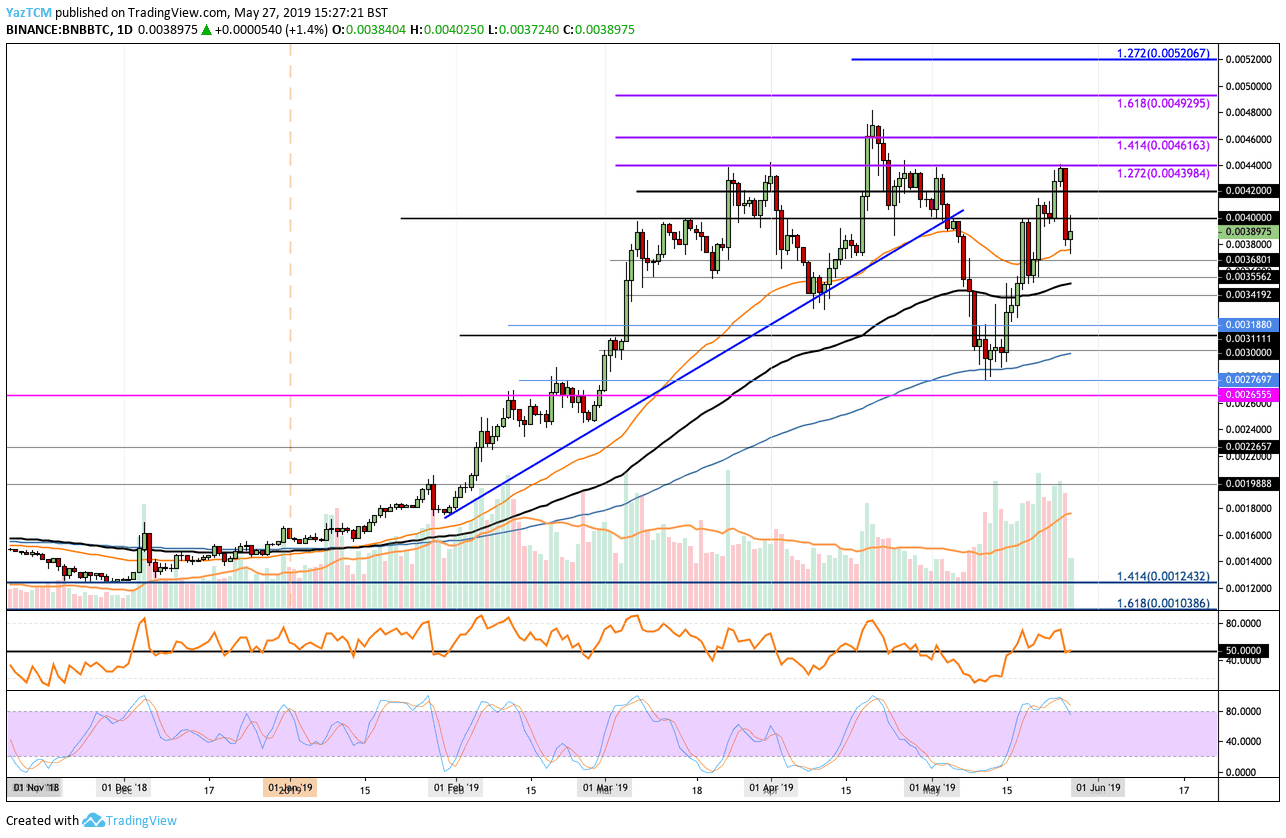
Looking at the BNB/BTC 1-Day Chart:
- Against Bitcoin, we can see that BNB continued to rebound from the 200-day moving average during mid-May, to reach the resistance at 0.004398 BTC. BNB/BTC has since fallen from this level of resistance to trade where it currently is at 0.003897 BTC.
- From above: The nearest level of resistance now lies at 0.0040 BTC and 0.0042 BTC. Above this, resistance is then located at 0.004398 BTC, 0.004616 BTC, and 0.004295 BTC.
- From below: The nearest level of support now lies at 0.0038 BTC and 0.003680 BTC. Beneath this, further support lies at 0.003556 BTC, 0.003419 BTC, and 0.0031880 BTC.
- The trading volume has also remained consistently above average during May 2019.
- The Stochastic RSI is also warning traders in BNB/BTC after producing a bearish crossunder in overbought territory. Furthermore, the RSI itself has recently dipped beneath the 50 level which suggests that the bears are in control of the market momentum.
The post Binance Coin Enjoys Bitcoin’s Rally To Record a New ATH: BNB Price Analysis May 27 appeared first on CryptoPotato.