Big Bounce to $0.9 Possible for XRP if This Critical Level Holds (Ripple Price Analysis)
Ripple’s price is yet to show any sign of bullishness after a decisive rejection from a significant resistance level. However, the market has currently reached a point where a rebound is probable.
Technical Analysis
By: Edris
The Daily Chart
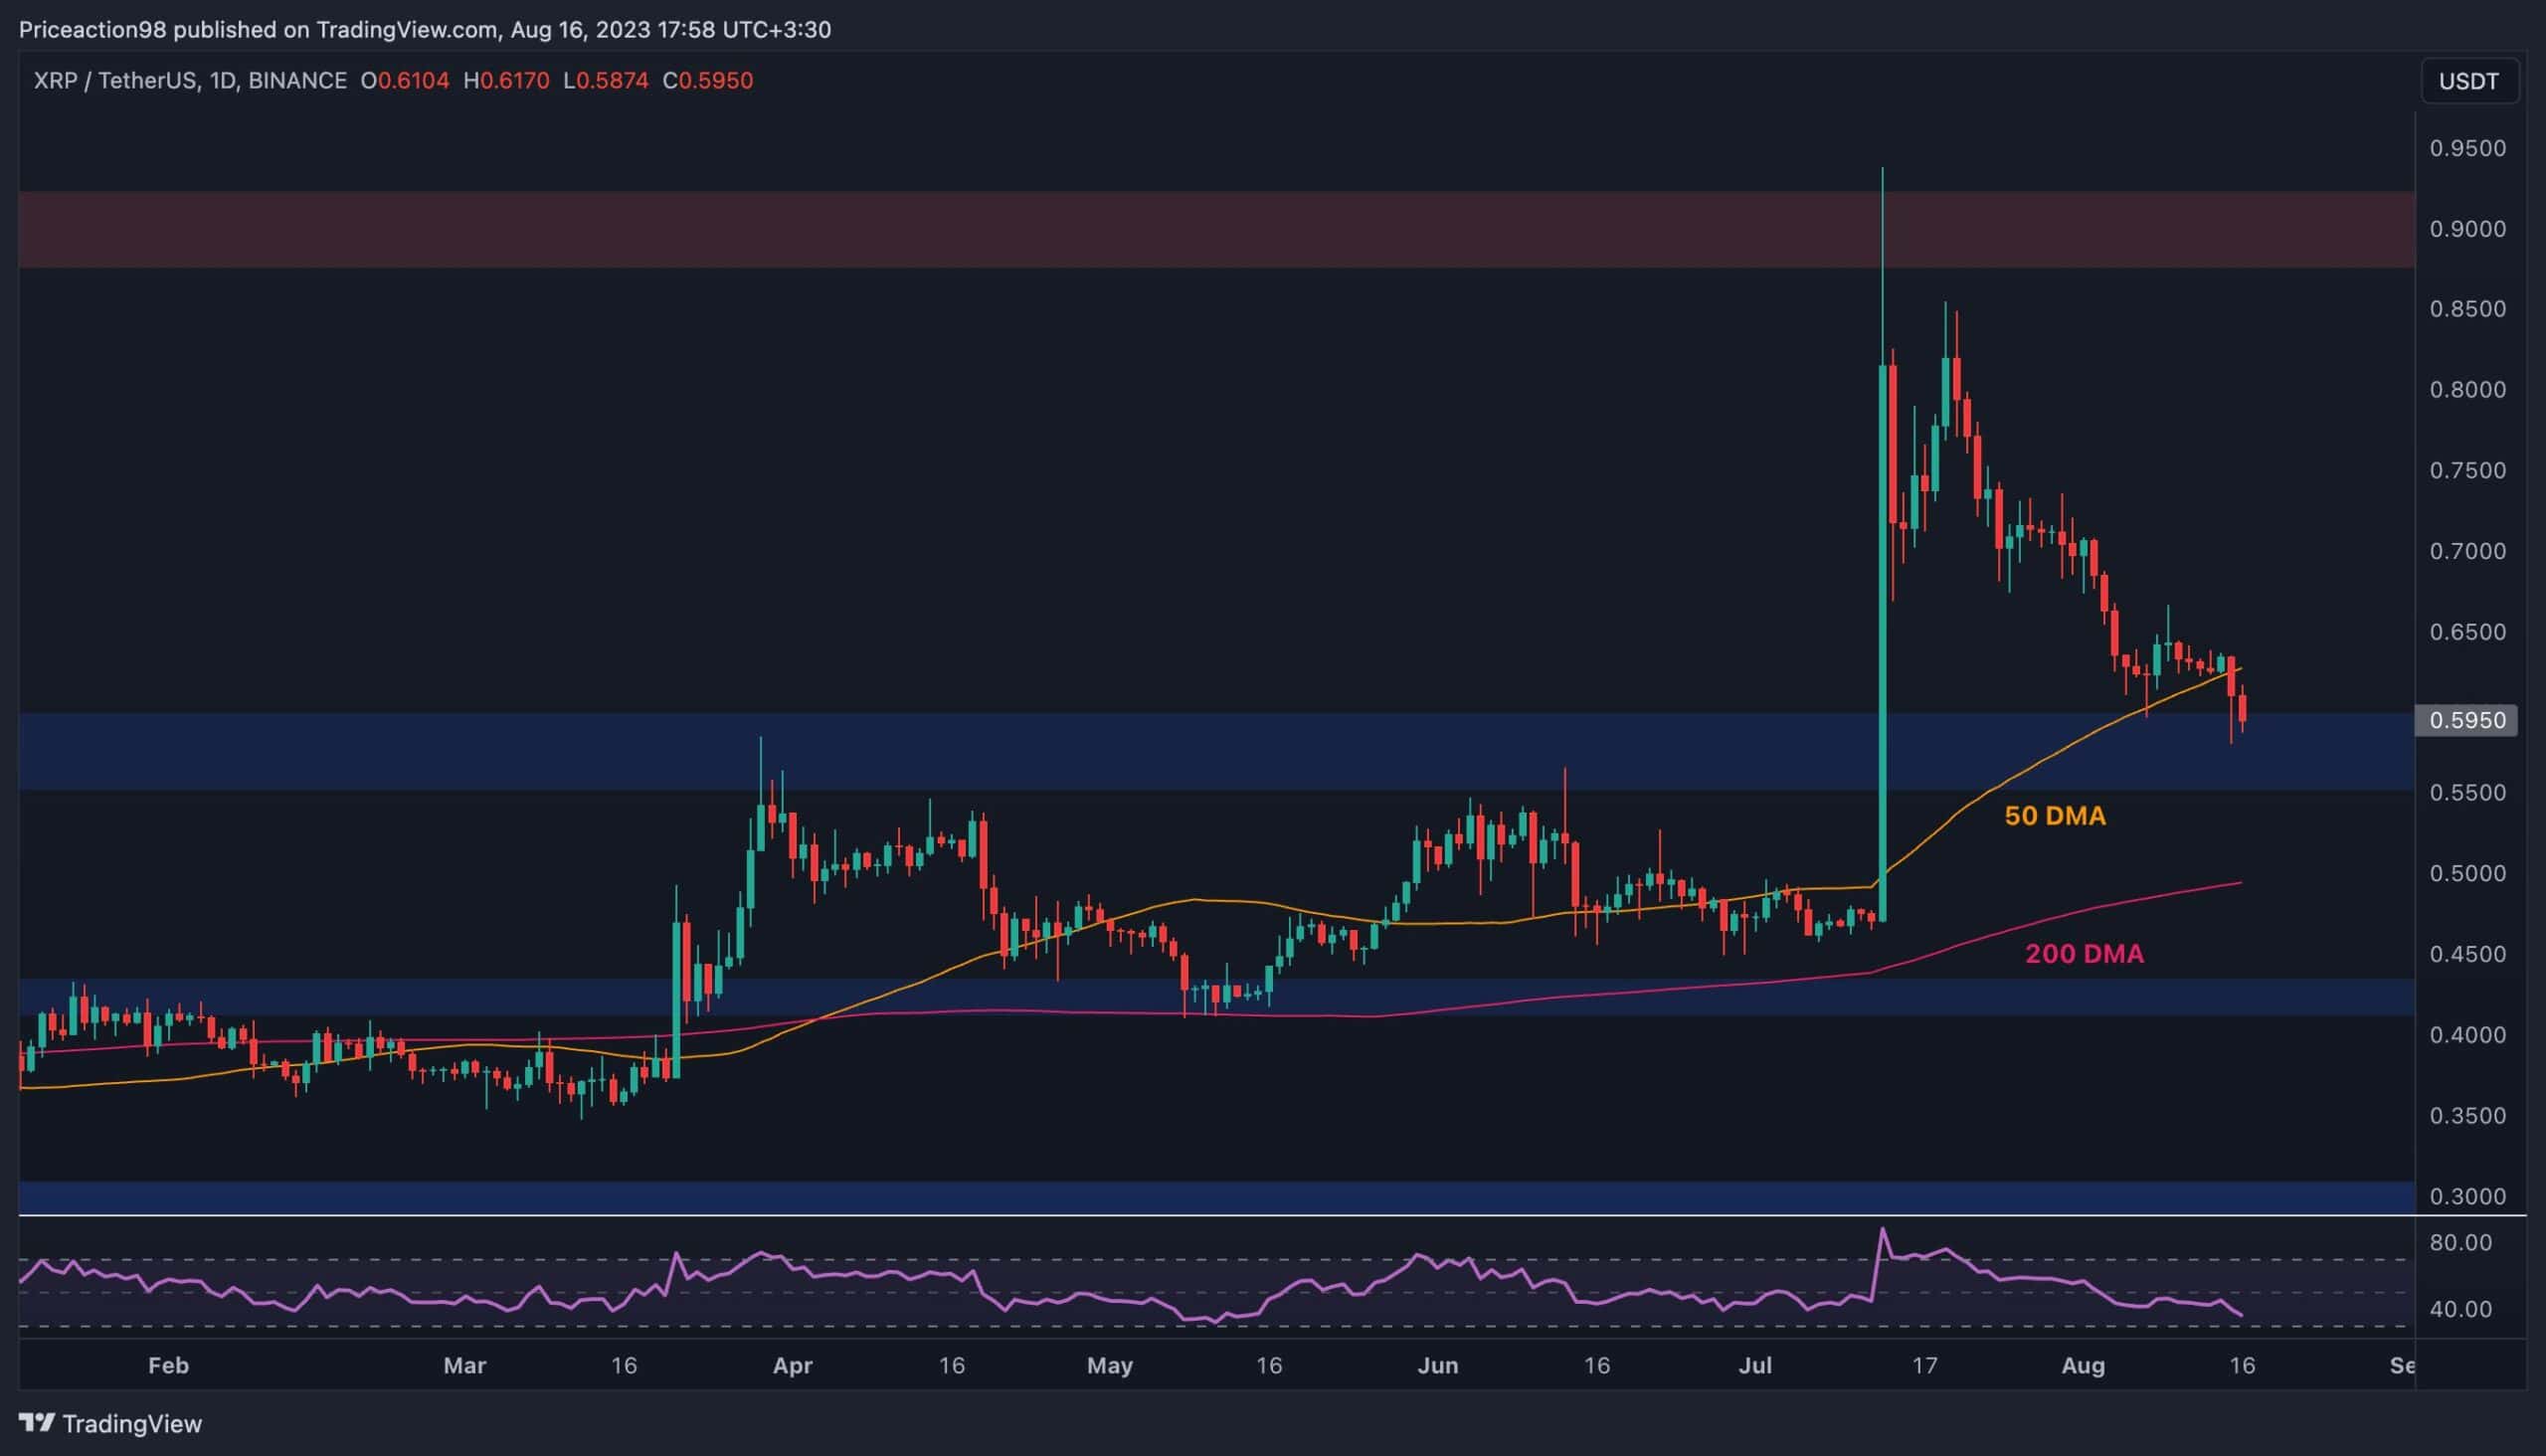
Against USDT, the cryptocurrency has been correcting since failing to break above the $0.9 level earlier in July. The 50-day moving average is broken to the downside, and the market is currently testing the significant $0.6 support level.
If this area holds, the investors may be optimistic about the price rallying towards the $0.9 resistance zone in the coming weeks. On the other hand, a breakdown of the mentioned support level would lead to a deeper drop toward the 200-day moving average, located around the $0.5 mark.
Against BTC
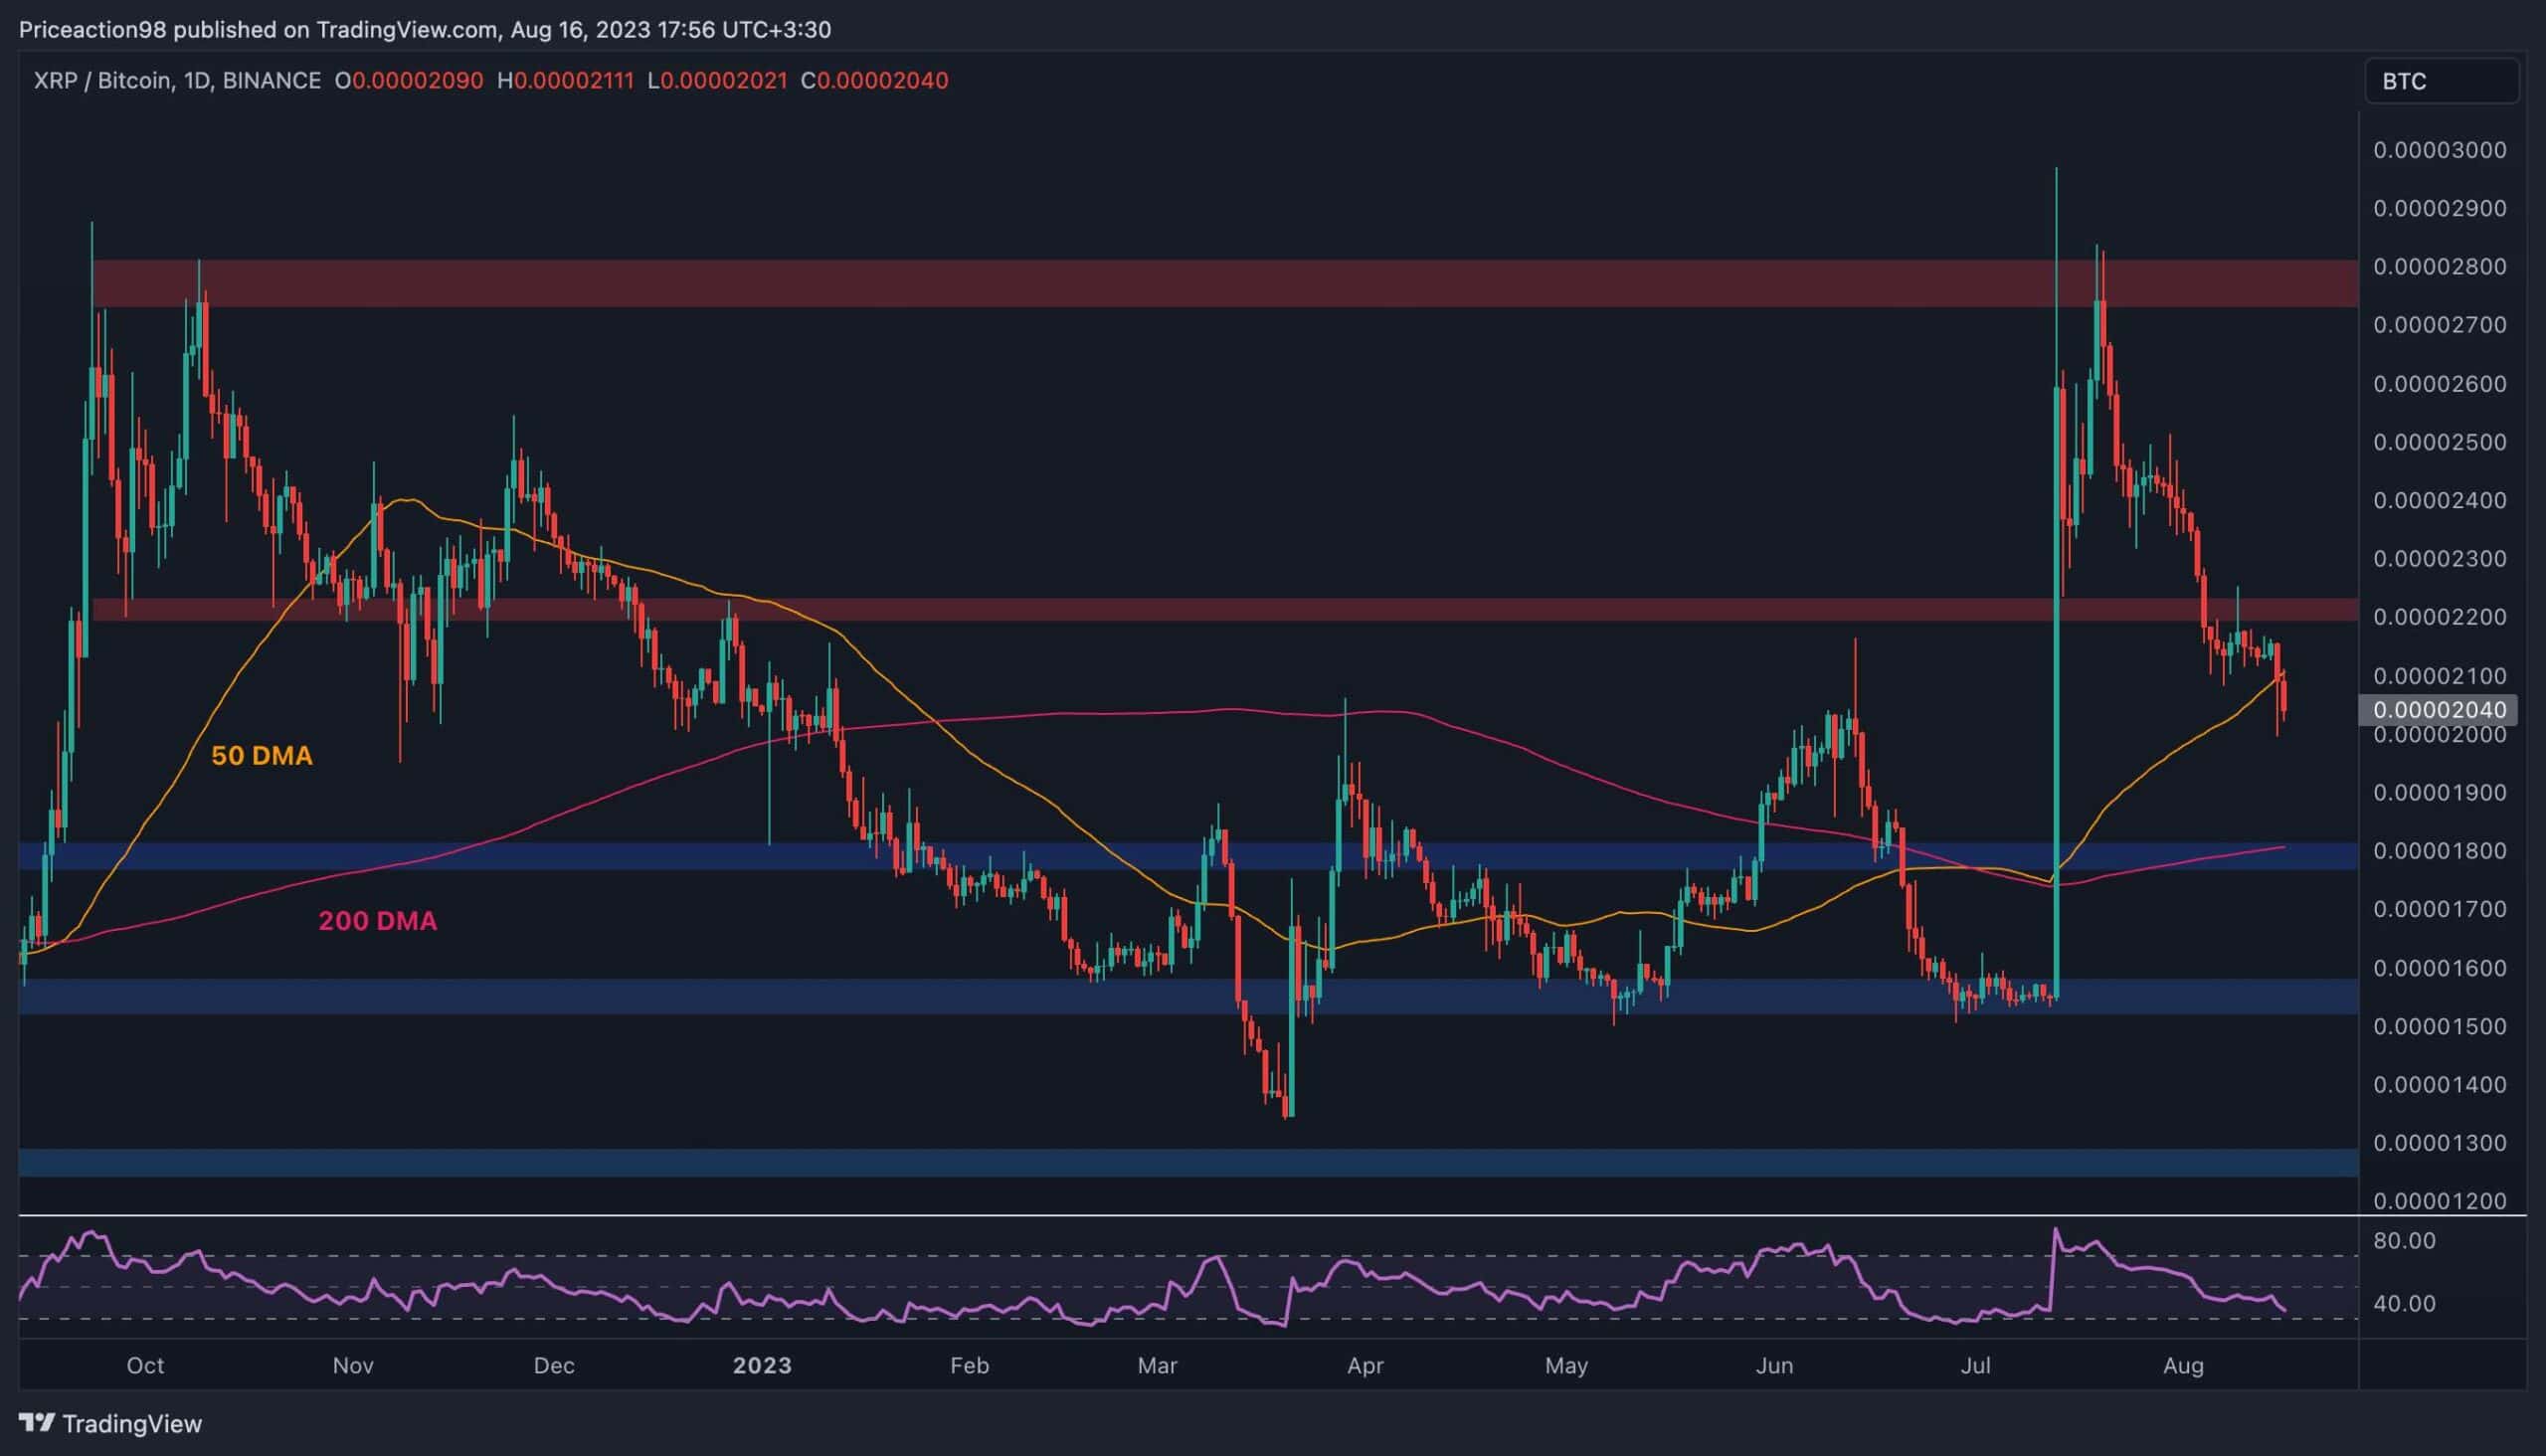
Looking at the chart against Bitcoin, things look worse. The price has broken below the 2200 SAT level, and the 50-day moving average located around the 2100 SAT mark.
Things seem worse, as the price is seemingly targeting the 200-day moving average and the nearby static support level at the 1800 SAT mark. Yet, this scenario could be invalidated in case the market climbs back above the broken 50-day MA.
The post Big Bounce to $0.9 Possible for XRP if This Critical Level Holds (Ripple Price Analysis) appeared first on CryptoPotato.