Avalanche Price Analysis: After a 18% Weekly Drop, Can AVAX Stop the Correction?
AVAX’s price has dropped over 80% since setting the all-time high at $147, but is it close to finding a bottom?
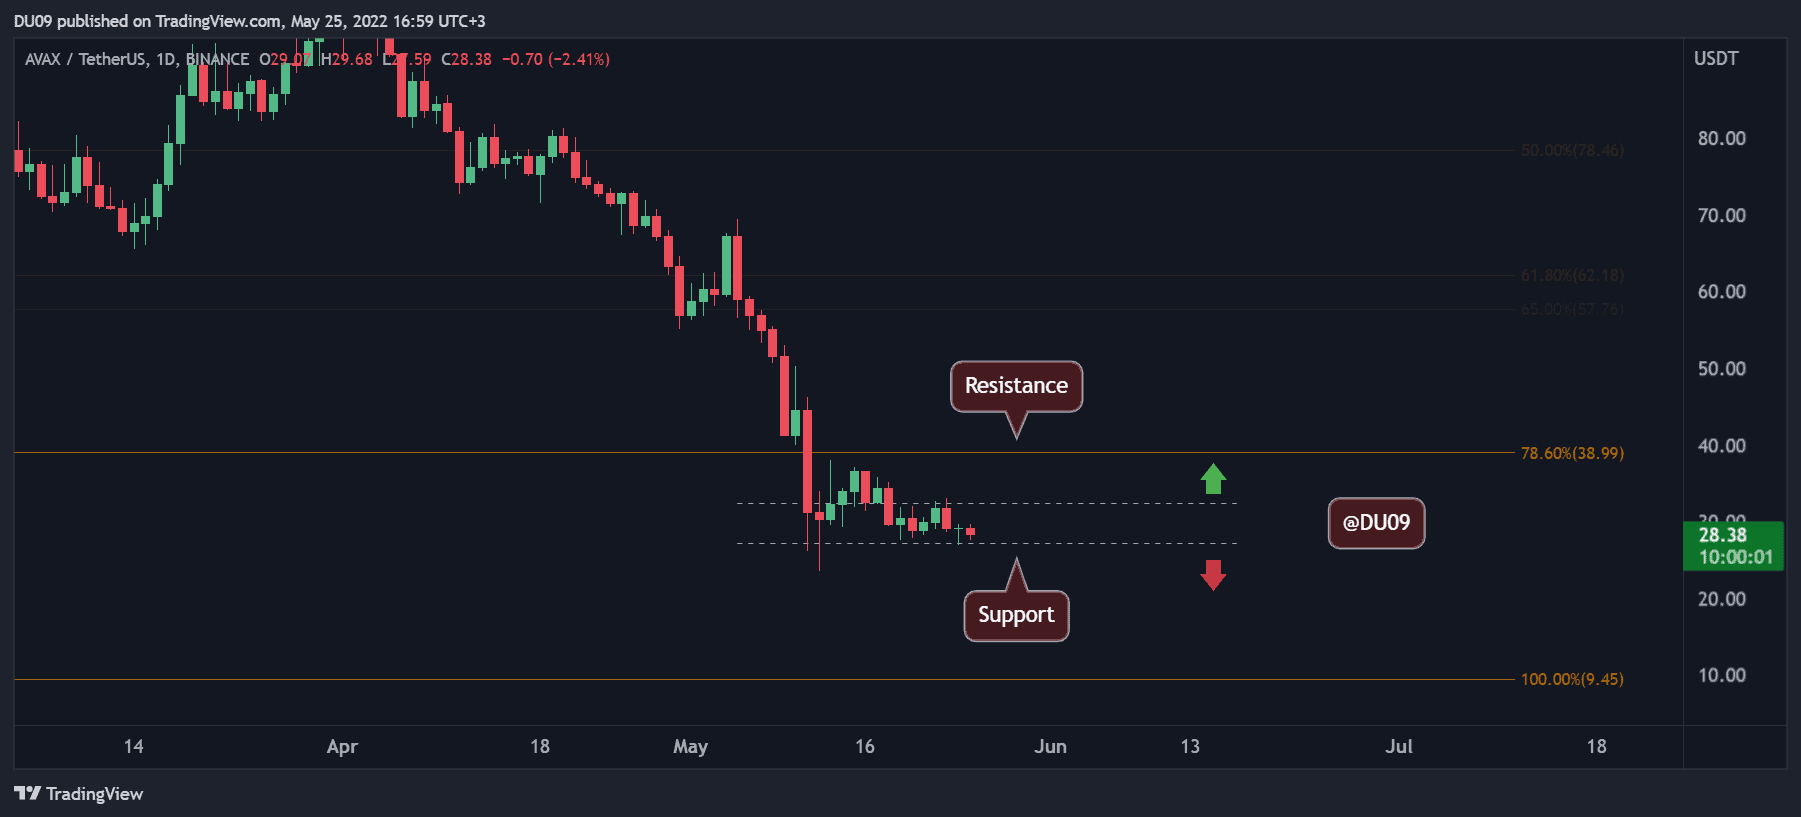
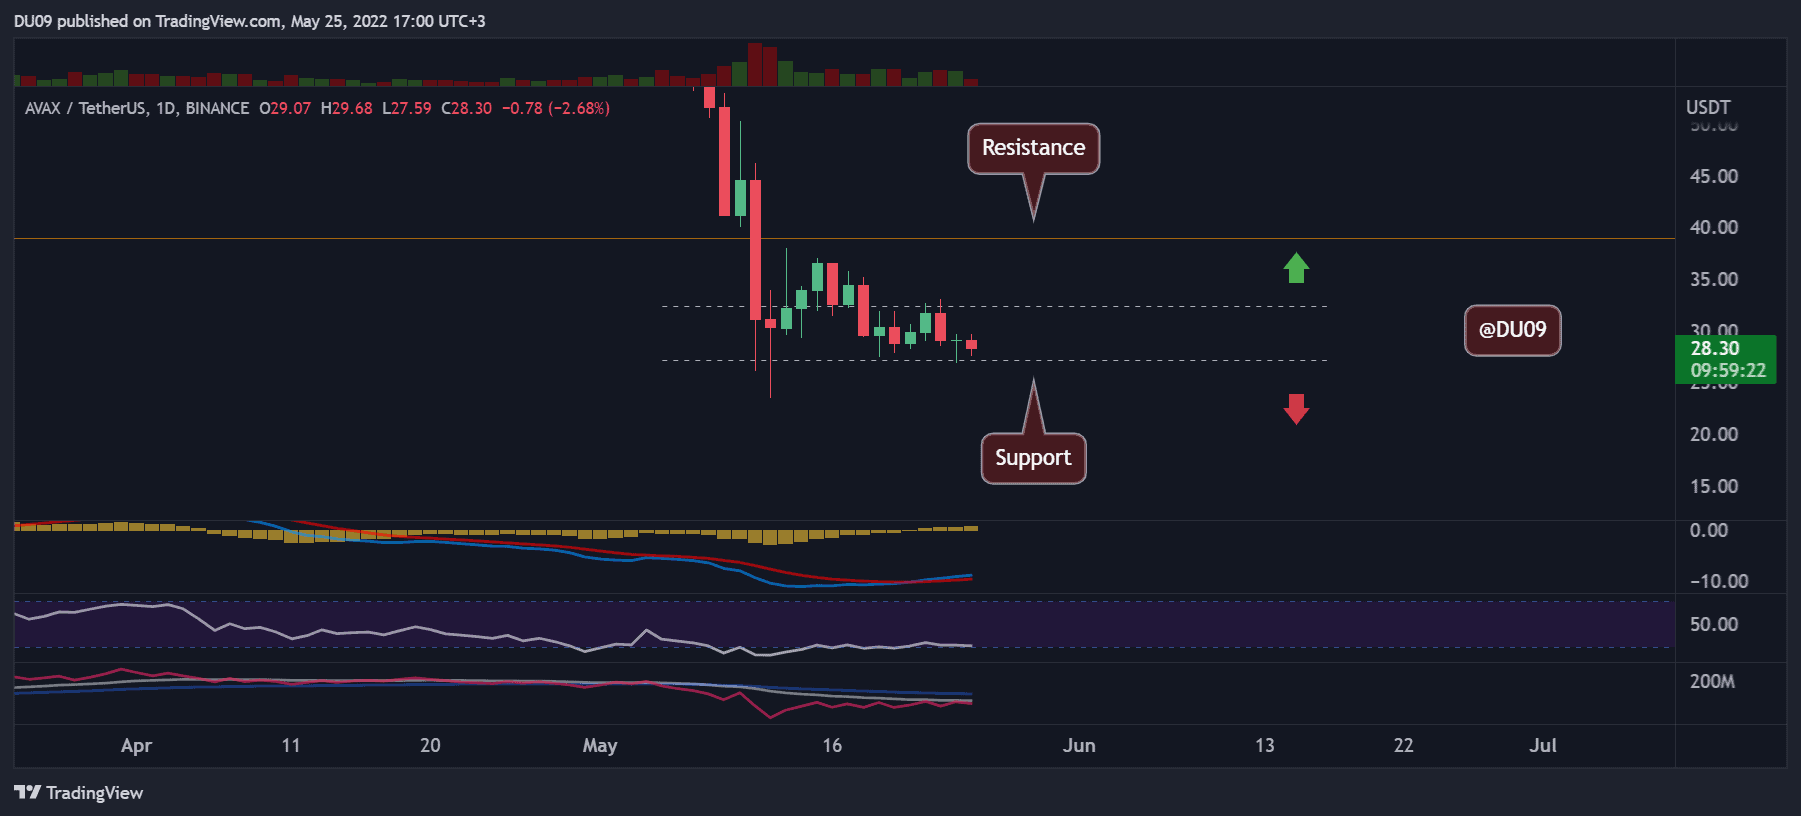
Key Support level: $28, $20
Key Resistance level: $32, $38
AVAX’s downtrend appears to have slowed down with the price finding solid support at $28. At the time of this post, the cryptocurrency is unwilling to go lower and the bulls will have to break the key resistance at $32 if they want to turn around the bearish momentum.

Technical Indicators
Trading Volume: The trading volume spiked during the crash on May 11th and since then, it has remained high with buyers coming in strong whenever the price falls under $30 – creating some sort of a local bottom around that area for the time being.
RSI: The daily RSI has managed to leave the oversold area at under 30 points, but failed to rally much higher.
MACD: The daily MACD is bullish, but shows a lack of conviction from buyers at this time. The bulls will have to break the key resistance to validate this signal.

Bias
The bias on AVAX is neutral. A break of the key levels is needed to change this bias.
Short-Term Prediction for AVAX Price
AVAX has closed the past seven weekly candles in red and is now approaching a moment when bulls may have a good chance to take over the price action and attempt a recovery. If they manage to break above $32, then Avalanche has a good shot at a relief rally.


