After Surging 33% in a Week, What’s Next for Cardano? (ADA Price Analysis)
ADA/USD – Bulls Rebound From 6-Month-Old Rising Trend Line
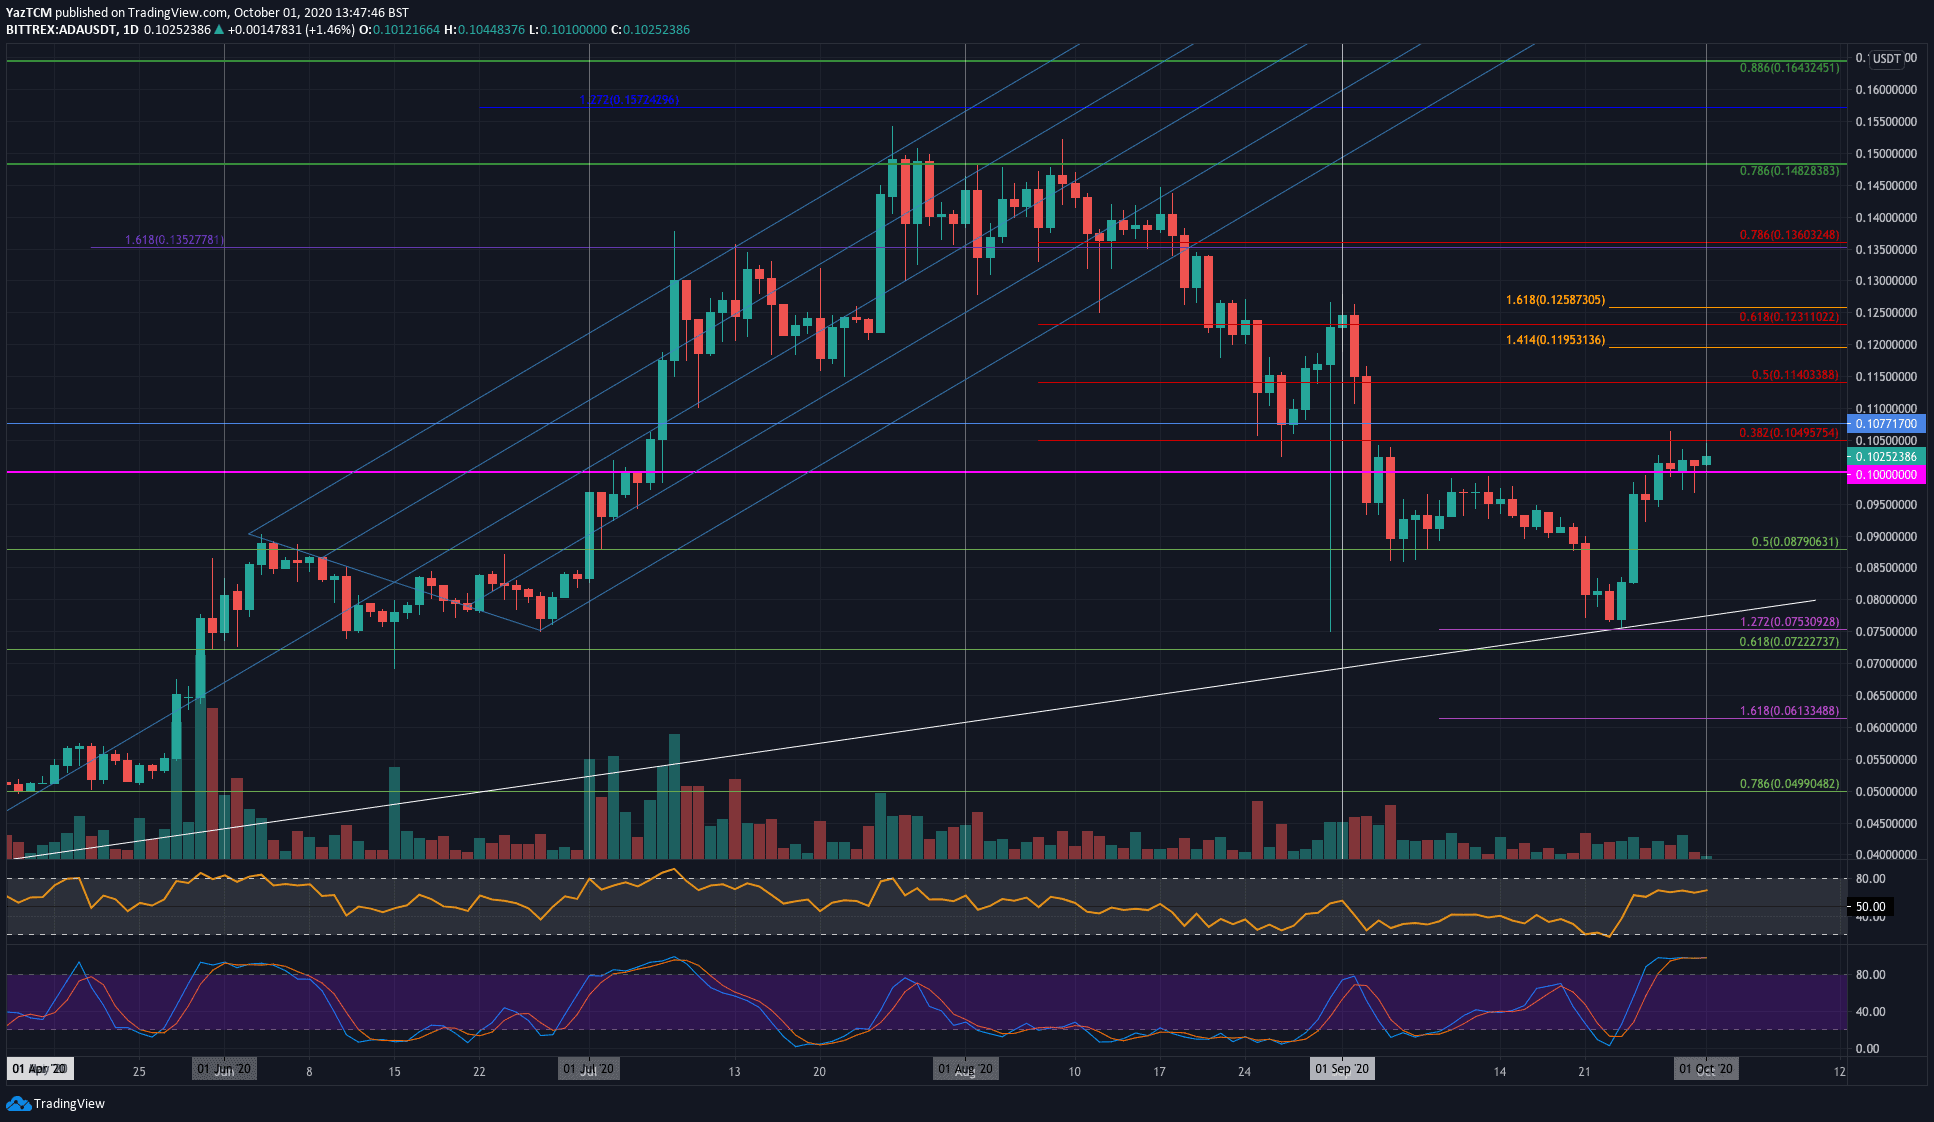
Key Support Levels: $0.1, $0.095, $0.087.
Key Resistance Levels: $0.105, $0.114, $0.12.
Cardano dropped from $0.125 in early September to initially reach the support at $0.087 (.5 Fib). The coin eventually penetrated beneath this level as we moved deeper into September and it headed lower into the support at $0.075 (downside 1.272 Fib Extension). The support there was bolstered by a 6-month-old rising trend line which allowed ADA to rebound last week.
After bouncing, it broke above $0.1 at the start of this week and has managed to close each daily candle above this level. Currently, ADA is facing strong resistance at a bearish .382 Fib at around $0.105.
ADA-USD Short Term Price Prediction
Looking ahead, if the bulls push past $0.105, the first level of resistance lies at $0.114 (bearish .5 Fib Retracement). This is followed by resistance at $0.12 (1.414 Fib extension), $0.123 (bearish .618 Fib), and $0.125 (Sep highs & 1.618 Fib Extension).
On the other side, the first level of support is expected at $0.1. Beneath this, support lies at $0.095, $0.09, $0.087 (.5 Fib), $0.082, and then the rising trend line.
The Stochastic RSI is in overbought conditions and a bearish crossover signal could put an end to this bullish push higher.
ADA/BTC – Cardano Struggling at Bearish .236 Fib Retracement
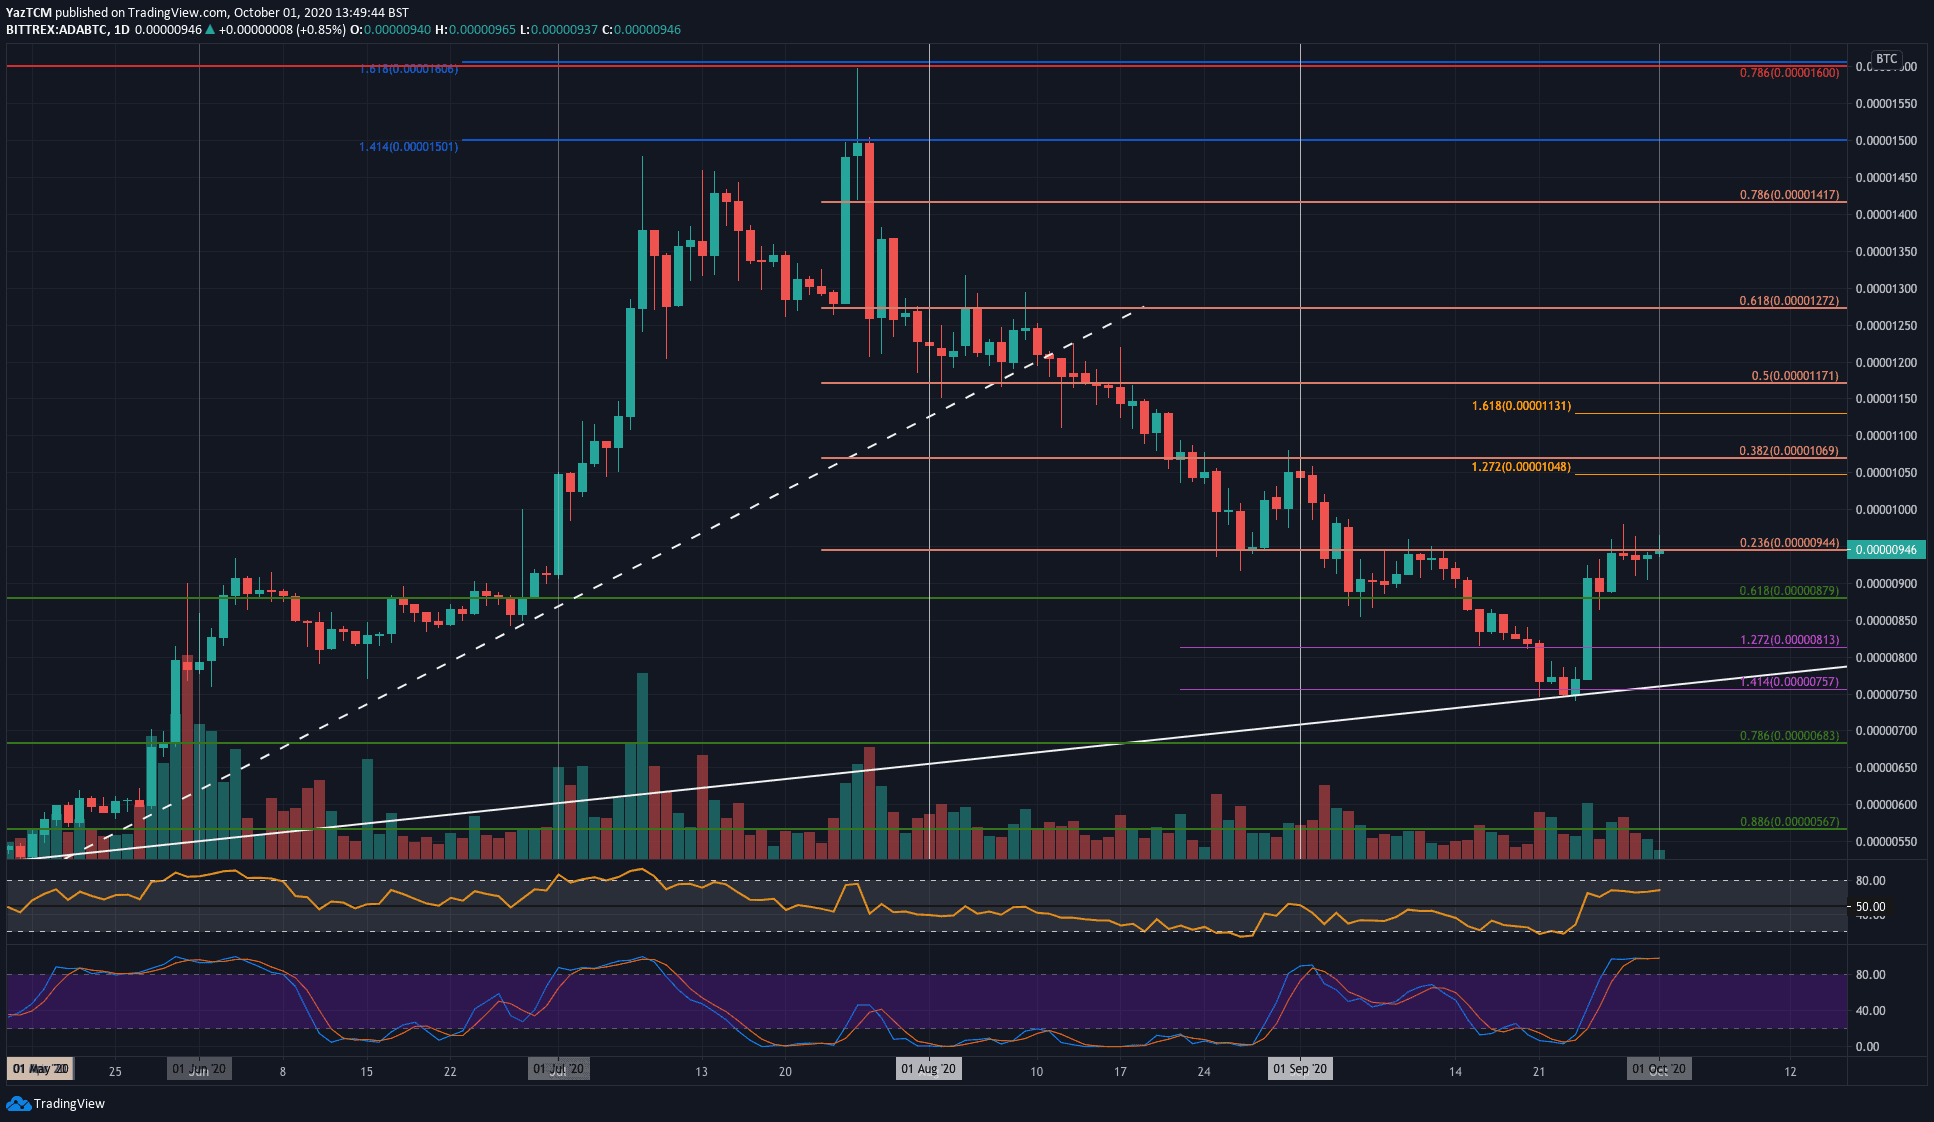
Key Support Levels: 900 SAT, 880 SAT, 810 SAT.
Key Resistance Levels: 945 SAT, 1000 SAT, 1070 SAT.
Against Bitcoin, the situation is fairly similar. ADA had dropped beneath the early September support at 880 SAT (.618 Fib) and continued lowed until finding support at a 6-month-old rising trend line at around 750 SAT last week.
From there, ADA bounced higher as it headed above 900 SAT. This week, Cardano has struggled to break the current resistance at 945 SAT, provided by a bearish .236 Fib Retracement.
ADA-BTC Short Term Price Prediction
Moving forward, once the bulls break 945 SAT, the first level of resistance lies at 1000 SAT. Above this, resistance is located at 1070 SAT (Sep Highs & bearish .382 Fib), 1130 SAT, and 1171 SAT (bearish .5 Fib).
On the other side, the first level of support lies at 900 SAT. Beneath this, support lies at 880 SAT (.618 Fib), 810 SAT, and then at the rising support trend line.
Likewise, the Stochastic RSI is also overbought at this moment and a bearish cross over signal could halt any further upward momentum.
The post After Surging 33% in a Week, What’s Next for Cardano? (ADA Price Analysis) appeared first on CryptoPotato.