After BTC’s $2K Crash in Two Days, Will This Level Stop the Bloodbath? (Bitcoin Price Analysis)
After last week’s excitement of a brand-new Bitcoin all-time high, the bulls forgot about the strong resistance at the key level of $20,000.
According to the basics of technical analysis, just as in soccer, if you do not break above – you lose force and regress. This is exactly what we see over the past two days, following another failed attempt at the $19,500 – $20K zone.
Since then, the Bitcoin price is going through a blood bath. The primary cryptocurrency had lost almost $2000 off its value over the 48 hours, as of writing these lines.
BTC Support and Resistance Levels To Watch
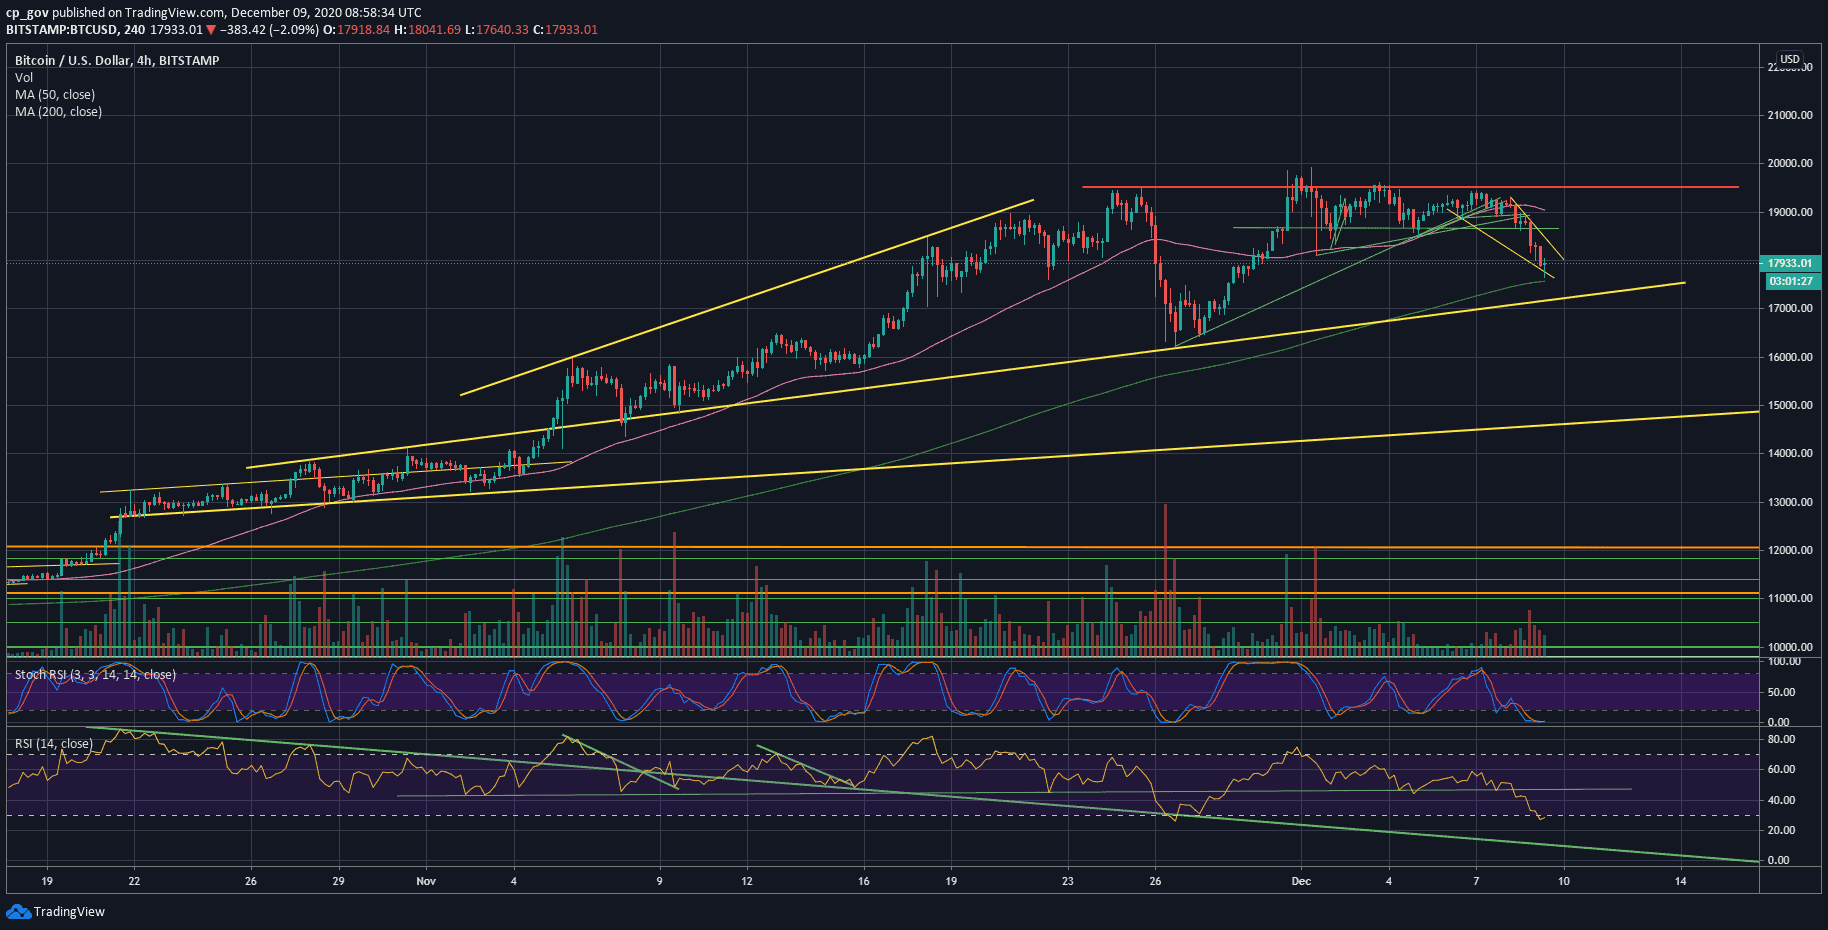
Looking at the following 4-hour chart, we can identify that since losing the critical support line at $18,700, Bitcoin’s price started plunging.
As of now, the 4-hour chart’s MA-200 line (marked light green), along with horizontal support of $17,560, could be the first significant level of support.
In case Bitcoin breaks it, the next possible major level of support is the mid-term ascending trend-line at around $17,250 – $17,300. The line was started forming in October.
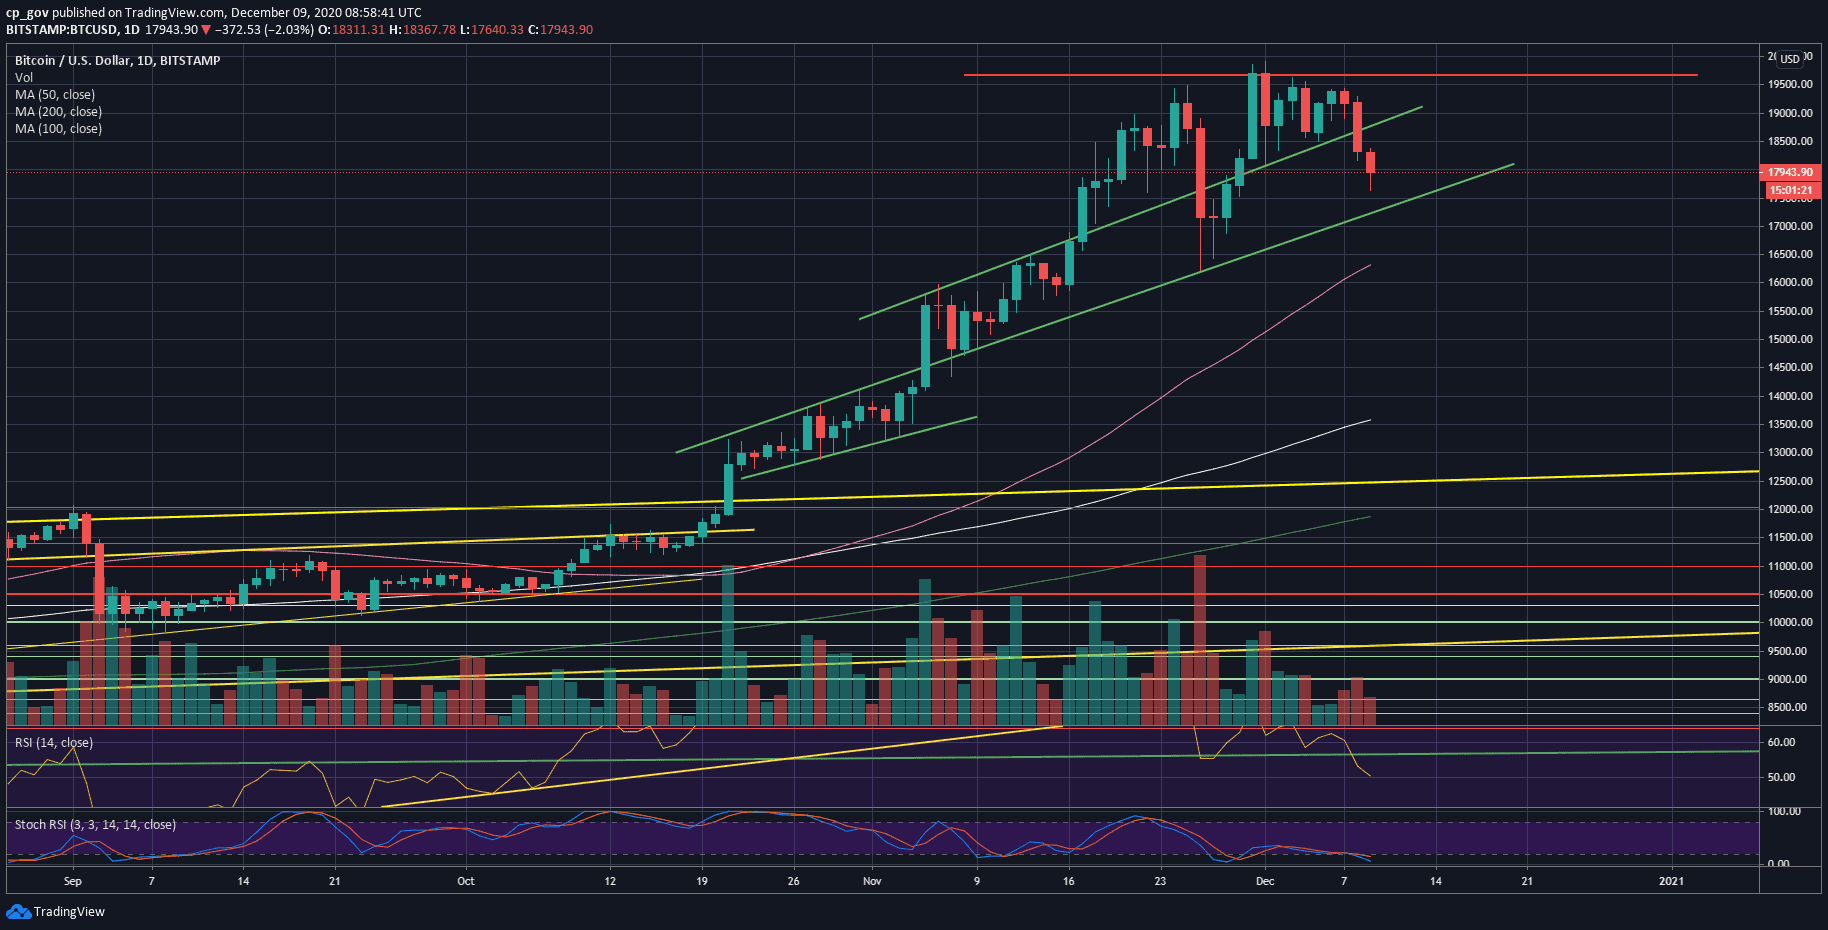
Further below lies $17,000, which is an open CME Futures gap, before $16,500 and the 50-days moving average line (marked by pink on the daily chart) at $16,300.
On the other hand, the RSI is getting to the oversold zone both on the daily and the 4-hour chart. The daily RSI is at its lowest level since October 2019.
In case that support holds, then the first level of support turned resistance is the $18K area, along with a short-term descending trend-line (yellow on the 4-hour chart). This is followed by $18,500 and $18,700 (the critical level mentioned above).
However, the major obstacle is still the all-time high area of $19,500 – $20K. There is a huge amount of resistance there. In case that Bitcoin finally breaks it, I expect a quick move to $22K.
Total Market Cap: $532 billion
Bitcoin Market Cap: $331 billion
BTC Dominance Index: 62.3%
*Data by CoinGecko
BTC/USD BitStamp 1-Day Chart
BTC/USD BitStamp 4-Hour Chart