$6.3K: Bitcoin Sell-Off Could Resume Should Key Support Break
Bitcoin (BTC) is currently still being squeezed into a tightening range, with support at $6,300 being a key level for the bulls to defend, technical charts indicate.
The leading cryptocurrency carved out a temporary bottom around $6,100 earlier this month and crossed resistance at $6,600 last Friday, confirming a double bottom bullish reversal.
However, the ensuing rally ran out of steam at highs above $6,800. More importantly, prices have fallen back below $6,600 this week, invalidating the bullish setup.
While the price action witnessed in the last seven days is demoralizing for the bulls, only a move below $7,400 – support of the trendline connecting the Sept. 8 low and Sept. 18 low – would confirm a bearish revival.
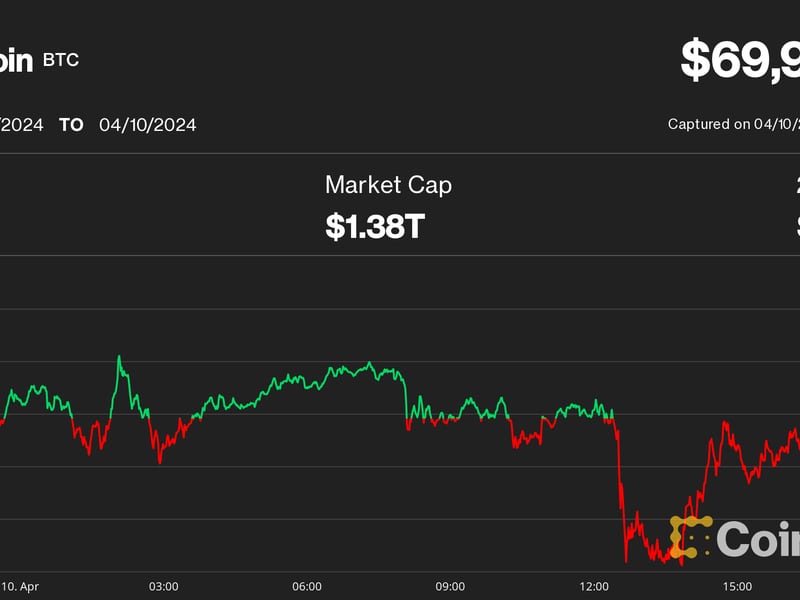
As of writing, BTC is trading largely unchanged on the day at $6,480 on Bitfinex.
Daily chart

On the daily chart, BTC has charted a bear flag – a bearish continuation pattern – which indicates the sell-off from the monthly high of $7,429 would resume if the cryptocurrency finds acceptance below the flag support (support of trendline from Sept. 78 lows) of $6,400.
A bear flag breakdown, if confirmed, would open the doors to $5,400 (target as per the measured move method). Moreover, it would also validate the bearish view put forward by the negative crossover between the 5-month and 10-month exponential moving averages (MAs).
Still, the bears would need to observe caution as the area around $6,000, which has acted as a strong support in the recent past, may put the brakes on the sell-off.
Hourly chart

Over on the hourly chart, BTC is already on the defensive, having breached the rising channel to the downside. Further, the 100-hour moving average (MA) has just crossed the 200-hour MA, confirming the path of least resistance is to the downside.
As a result, the odds of BTC falling below the crucial support of $6,300 in the next 24 hours are high.
View
- BTC could be in for a bigger drop toward the June low of $5,755 if the flag support of $6,300 is breached.
- On the way lower, BTC may encounter strong support around $6,000. A solid rebound from that level would neutralize the bearish setup.
- On the higher side, a convincing move above $6,588 (previous day’s high) would weaken the bearish case put forward by the hourly chart.
Disclosure: The author holds no cryptocurrency assets at the time of writing.
Bitcoin image via Shutterstock; Charts by Trading View
Join 10,000+ traders who come to us to be their eyes on the charts and sign up for Markets Daily, sent Monday-Friday. By signing up, you agree to our terms & conditions and privacy policy
The leader in blockchain news, CoinDesk is a media outlet that strives for the highest journalistic standards and abides by a strict set of editorial policies. CoinDesk is an independent operating subsidiary of Digital Currency Group, which invests in cryptocurrencies and blockchain startups.